RNA correlated compartment#
import numpy as np
import pandas as pd
import cooler
import anndata
import scanpy as sc
import matplotlib as mpl
import matplotlib.pyplot as plt
from matplotlib.colors import LogNorm
from matplotlib import cm as cm
import seaborn as sns

mpl.style.use('default')
mpl.rcParams['pdf.fonttype'] = 42
mpl.rcParams['ps.fonttype'] = 42
mpl.rcParams['font.family'] = 'sans-serif'
mpl.rcParams['font.sans-serif'] = 'Helvetica'
indir = f'/home/jzhou_salk_edu/sky_workdir/hba/compartment_majortype/diff/neu/'
outdir = '/home/jzhou_salk_edu/sky_workdir/hba/rna_majortype/'
# no L5ET
leg = ['L23_IT', 'L4_IT', 'L5_IT', 'L6_IT', 'L6_IT_Car3', 'L56_NP', 'L6_CT', 'L6b', 'Amy',
       'Lamp5', 'Lamp5_LHX6', 'Sncg', 'Vip', 'Pvalb', 'Pvalb_ChC', 'Sst', 'CHD7',
       'MSN_D1', 'MSN_D2', 'Foxp2', 'SubCtx',
       # 'ASC', 'ODC', 'OPC', 'MGC', 'PC', 'EC', 'VLMC'
      ]
res = 100000
comp = pd.read_csv(f'{indir}DifferentialResult/fdr_result/differential.intra_sample_combined.pcQnm.bedGraph', sep='\t', header=0, index_col=None)
comp.index = comp['chr'] + '_' + (comp['start'] // res).astype(str)
comp
| chr | start | end | L23_IT_100Kb | L4_IT_100Kb | L5_IT_100Kb | L6_IT_100Kb | L6_IT_Car3_100Kb | L56_NP_100Kb | L6_CT_100Kb | ... | Sst | CHD7 | MSN_D1 | MSN_D2 | Foxp2 | SubCtx | sample_maha | pval | padj | dist_clust | |
|---|---|---|---|---|---|---|---|---|---|---|---|---|---|---|---|---|---|---|---|---|---|
| chr10_2 | chr10 | 200000 | 300000 | 1.20141 | 1.40148 | 1.12274 | 0.91856 | 0.71971 | 1.45364 | 1.35924 | ... | 1.60003 | 1.79399 | 1.18581 | 1.14140 | 1.64998 | 1.77294 | 78.797991 | 6.274326e-09 | 1.654675e-08 | 1 |
| chr10_3 | chr10 | 300000 | 400000 | 1.67618 | 1.43001 | 1.33450 | 1.32691 | 0.51945 | 1.22911 | 1.53759 | ... | 1.69831 | 1.69831 | 1.61143 | 1.15231 | 1.94190 | 2.06830 | 101.685104 | 6.282661e-13 | 1.940153e-12 | 1 |
| chr10_4 | chr10 | 400000 | 500000 | 1.27442 | 1.33094 | 1.21215 | 1.43974 | 0.96214 | 1.59233 | 1.40148 | ... | 1.58100 | 1.61143 | 1.64171 | 1.62984 | 1.69065 | 1.68152 | 28.864611 | 9.045962e-02 | 1.563036e-01 | 1 |
| chr10_5 | chr10 | 500000 | 600000 | 1.43001 | 1.39806 | 1.69428 | 1.60003 | 0.57439 | 1.61143 | 1.37993 | ... | 1.76052 | 1.79952 | 1.58100 | 1.83248 | 1.55484 | 2.17604 | 110.773702 | 1.418987e-14 | 4.640257e-14 | 1 |
| chr10_6 | chr10 | 600000 | 700000 | 1.43350 | 1.69065 | 1.44978 | 1.66232 | 1.23573 | 1.26750 | 1.73916 | ... | 1.90078 | 1.82624 | 1.85399 | 1.42406 | 1.60286 | 1.35578 | 8.253318 | 9.900547e-01 | 1.000000e+00 | 1 |
| ... | ... | ... | ... | ... | ... | ... | ... | ... | ... | ... | ... | ... | ... | ... | ... | ... | ... | ... | ... | ... | ... |
| chr9_1367 | chr9 | 136700000 | 136800000 | 2.53781 | 2.49765 | 2.43707 | 2.53781 | 2.64364 | 2.50284 | 2.61332 | ... | 2.49765 | 2.30178 | 2.55214 | 2.61332 | 2.42730 | 2.37386 | 0.208439 | 1.000000e+00 | 1.000000e+00 | 1 |
| chr9_1368 | chr9 | 136800000 | 136900000 | 2.25818 | 2.34290 | 2.30178 | 2.27476 | 2.20722 | 2.28698 | 2.49765 | ... | 2.35196 | 2.29048 | 2.25515 | 2.25515 | 2.17299 | 2.22961 | 1.756256 | 1.000000e+00 | 1.000000e+00 | 1 |
| chr9_1369 | chr9 | 136900000 | 137000000 | 2.26494 | 2.13128 | 2.34837 | 2.37084 | 2.33576 | 2.35196 | 2.46547 | ... | 2.39138 | 2.22605 | 2.35521 | 2.31751 | 2.40634 | 2.33914 | 0.318975 | 1.000000e+00 | 1.000000e+00 | 1 |
| chr9_1370 | chr9 | 137000000 | 137100000 | 2.35196 | 2.04449 | 2.36778 | 2.18888 | 2.30471 | 2.28174 | 2.42333 | ... | 2.35761 | 2.25818 | 2.30178 | 2.18888 | 2.30759 | 2.36778 | 0.952000 | 1.000000e+00 | 1.000000e+00 | 1 |
| chr9_1372 | chr9 | 137200000 | 137300000 | 2.33276 | 2.13811 | 2.29494 | 2.32970 | 2.46547 | 2.41199 | 2.52050 | ... | 2.46547 | 2.46252 | 2.38687 | 2.35196 | 2.32339 | 2.21984 | 0.170553 | 1.000000e+00 | 1.000000e+00 | 1 |
24745 rows × 49 columns
binall = comp[['chr', 'start', 'end', 'sample_maha', 'pval', 'padj']]
binall = binall.rename({'chr':'chrom'}, axis=1)
comp = comp[leg]
expr = pd.read_hdf('/home/jzhou_salk_edu/sky_workdir/hba/rna_majortype/cluster_expr.hdf').loc[leg]
from scipy.stats import rankdata

deg = np.zeros(expr.shape[1])
for i in range(len(leg)-1):
    for j in range(i+1, len(leg)):
        tmp = np.load(f'/home/jzhou_salk_edu/sky_workdir/hba/rna_majortype/DEG/{leg[i]}-{leg[j]}.npz')
        # deg[np.logical_and(np.abs(tmp['fc'])>1, tmp['fdr']<1e-3)] = 1
        rank = rankdata(tmp['fdr'])
        deg[rank<=100] = 1

print(deg.sum())
1131.0
chrom_size_path = f'/data/hba/loop_majortype/hg38_with_chrl.main.chrom.sizes'
chrom_sizes = cooler.read_chromsizes(chrom_size_path, all_names=True)
gene_meta = pd.read_csv('/home/jzhou_salk_edu/sky_workdir/hba/ref/gencode.v33.bed', sep='\t', index_col=None, header=None)
gene_meta.columns = ['chrom', 'start', 'end', 'gene_id', 'gene_name', 'strand']
gene_meta = gene_meta.set_index('gene_id').loc[expr.columns[deg==1]]
gene_meta = gene_meta.loc[gene_meta['chrom'].isin(chrom_sizes.index[:22])]
gene_meta
| chrom | start | end | gene_name | strand | |
|---|---|---|---|---|---|
| gene | |||||
| ENSG00000002746.15 | chr7 | 43112629 | 43566001 | HECW1 | + |
| ENSG00000005108.16 | chr7 | 11370365 | 11832198 | THSD7A | - |
| ENSG00000006128.12 | chr7 | 97732084 | 97740472 | TAC1 | + |
| ENSG00000006468.14 | chr7 | 13891229 | 13991425 | ETV1 | - |
| ENSG00000007237.18 | chr17 | 9910609 | 10198551 | AC005747.1 | - |
| ... | ... | ... | ... | ... | ... |
| ENSG00000286954.1 | chr6 | 22663507 | 22675493 | AL033539.2 | + |
| ENSG00000287172.1 | chr2 | 76185020 | 76399490 | AC073091.3 | + |
| ENSG00000287694.1 | chr16 | 76277288 | 76819624 | AC106741.2 | + |
| ENSG00000287722.1 | chr13 | 53207831 | 53801489 | AL356295.1 | + |
| ENSG00000287912.1 | chr11 | 81175201 | 81431520 | AP003464.1 | + |
1099 rows × 5 columns
import joblib
# from qnorm import quantile_normalize
from scipy.stats import norm
from statsmodels.sandbox.stats.multicomp import multipletests as FDR
from tqdm import tqdm
from ALLCools.mcds.correlation import corr_array
def shuffle_corr_norm(rna_data, dmr_data):

    shuffle_rna_data = rna_data.copy()
    for col, data in shuffle_rna_data.items():
        n_gene = shuffle_rna_data.shape[0]
        shuffle_rna_data[col] = shuffle_rna_data[col].sample(n_gene).values

    if dmr_data.shape[0] > 50000:
        shuffle_dmr_data = dmr_data.sample(50000).copy()
    else:
        shuffle_dmr_data = dmr_data.copy()
    for col, data in shuffle_dmr_data.items():
        n_dmr = shuffle_dmr_data.shape[0]
        shuffle_dmr_data[col] = shuffle_dmr_data[col].sample(n_dmr).values

    # shuffle corr
    shuffle_corr = corr_array(shuffle_rna_data, shuffle_dmr_data)
    mu, std = norm.fit(shuffle_corr.ravel())
    return mu, std, shuffle_corr.ravel()
null_mu, null_std, shuffle_corr = shuffle_corr_norm(expr.loc[:,  expr.columns.isin(gene_meta.index)].T, comp)
null_mu, null_std
(3.360401866366818e-06, 0.22354448644380281)
shuffle_corr.shape
(27194755,)
gene_slop = 5000000
binall['pos'] = binall[['start', 'end']].mean(axis=1)
gene_records = []
for gene, row in tqdm(gene_meta.iterrows(), total=gene_meta.shape[0]):
    gene_rna = expr[[gene]].T

    dmr_chrom = row['chrom']
    dmr_start = row['start'] - gene_slop
    dmr_end = row['end'] + gene_slop
    sel_dmr = (binall['chrom']==dmr_chrom) & (binall['pos'] > dmr_start) & (binall['pos'] < dmr_end)
    gene_dmr = comp.loc[sel_dmr]

    gene_corr = corr_array(gene_rna, gene_dmr).ravel()
    gene_corr = pd.Series(gene_corr, index=gene_dmr.index)

    # pvalue = norm.sf(gene_corr.values, null_mu, null_std)
    # pvalue[pvalue > 0.5] = 1 - pvalue[pvalue > 0.5]
    # pvalue *= 2  # two tailed
    # perform multi-test correction and  q-value
    # _, q, *_ = fdrcorrection(pvalue)

    gene_corr.name = 'corr'
    gene_corr = gene_corr.reset_index()
    gene_corr['gene'] = gene
    # gene_corr["q"] = q

    # minimum filter
    # gene_corr = gene_corr[
    #     (gene_corr["q"] < min_q) & (gene_corr["corr"].abs() > min_corr)
    # ].set_index("dmr")

    # gene_records[gene] = gene_corr
    gene_records.append(gene_corr)
100%|██████████| 1099/1099 [00:03<00:00, 293.25it/s]
gene_records = pd.concat(gene_records, axis=0)
gene_records.index = np.arange(gene_records.shape[0])
gene_records
| index | corr | gene | |
|---|---|---|---|
| 0 | chr7_381 | 0.216611 | ENSG00000002746.15 |
| 1 | chr7_382 | 0.309620 | ENSG00000002746.15 |
| 2 | chr7_383 | 0.413378 | ENSG00000002746.15 |
| 3 | chr7_384 | 0.452824 | ENSG00000002746.15 |
| 4 | chr7_385 | 0.422503 | ENSG00000002746.15 |
| ... | ... | ... | ... |
| 105394 | chr11_859 | 0.110637 | ENSG00000287912.1 |
| 105395 | chr11_860 | 0.011490 | ENSG00000287912.1 |
| 105396 | chr11_861 | 0.264604 | ENSG00000287912.1 |
| 105397 | chr11_862 | 0.210742 | ENSG00000287912.1 |
| 105398 | chr11_863 | 0.257057 | ENSG00000287912.1 |
105399 rows × 3 columns
fig, ax = plt.subplots()
sns.distplot(np.random.choice(gene_records['corr'], 50000), ax=ax)
sns.distplot(np.random.choice(shuffle_corr, 50000), ax=ax)
<AxesSubplot:ylabel='Density'>
findfont: Font family ['sans-serif'] not found. Falling back to DejaVu Sans.
findfont: Generic family 'sans-serif' not found because none of the following families were found: Helvetica
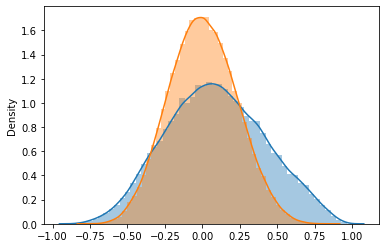
t1 = rankdata(np.concatenate((gene_records['corr'].values, shuffle_corr)))[:gene_records.shape[0]]
t2 = rankdata(gene_records['corr'].values)
gene_records['FDRneg'] = (t1 - t2) / len(shuffle_corr) / t2 * gene_records.shape[0]
gene_records['FDRpos'] = (len(shuffle_corr) - t1 + t2) / len(shuffle_corr) / (gene_records.shape[0] - t2) * gene_records.shape[0]
threspos = gene_records.loc[gene_records['FDRpos']<0.1, 'corr'].min()
thresneg = gene_records.loc[gene_records['FDRneg']<0.1, 'corr'].max()
print(threspos, thresneg)
0.5029179099915155 -0.6172767127895147
gene_meta[['TSS', 'TES']] = gene_meta[['start', 'end']]
selg = (gene_meta['strand']=='-')
gene_meta.loc[selg, ['TSS', 'TES']] = gene_meta.loc[selg, ['TES', 'TSS']].values
gene_records['TSSdist'] = binall.loc[gene_records['index'], 'pos'].values - gene_meta.loc[gene_records['gene'], 'TSS'].values
selg = (gene_meta.loc[gene_records['gene'], 'strand']=='-')
gene_records.loc[selg.values, 'TSSdist'] = -gene_records.loc[selg.values, 'TSSdist'].values

gene_records['TESdist'] = binall.loc[gene_records['index'], 'pos'].values - gene_meta.loc[gene_records['gene'], 'TES'].values
selg = (gene_meta.loc[gene_records['gene'], 'strand']=='-')
gene_records.loc[selg.values, 'TESdist'] = -gene_records.loc[selg.values, 'TESdist'].values
gene_records['coord'] = 0
selp = (gene_records['TSSdist']<=0)
gene_records.loc[selp, 'coord'] = gene_records.loc[selp, 'TSSdist'] / res * 4 - 100

selp = (gene_records['TESdist']>=0)
gene_records.loc[selp, 'coord'] = gene_records.loc[selp, 'TESdist'] / res * 4 + 100

selp = (gene_records['TESdist']<0) & (gene_records['TSSdist']>0)
gene_records.loc[selp, 'coord'] = gene_records.loc[selp, 'TSSdist'] / (gene_records.loc[selp, 'TSSdist'] - gene_records.loc[selp, 'TESdist']) * 200 - 100
gene_records.to_hdf(f'{outdir}DEG_neu_comp_5M_corr.hdf', key='data')
gene_records = pd.read_hdf(f'{outdir}DEG_neu_comp_5M_corr.hdf', key='data')
thres = np.max(np.abs([thresneg, threspos]))
gene_records['group'] = gene_records['coord']//2
proppos = (gene_records.loc[gene_records['corr']>thres, 'group'].value_counts() / gene_records['group'].value_counts()).sort_index().fillna(0)
propneg = (gene_records.loc[gene_records['corr']<-thres, 'group'].value_counts() / gene_records['group'].value_counts()).sort_index().fillna(0)
fig, ax = plt.subplots(figsize=(3, 1.5), dpi=300)
ax.plot(np.arange(300), proppos, c='C0', label='Pos')
ax.plot(np.arange(300), propneg, c='C1', label='Neg')
ax.set_xticks([0, 100, 200, 300])
ax.set_xticklabels(['-5M', 'TSS', 'TES', '+5M'])
ax.legend()
plt.tight_layout()
# plt.savefig('proportion_corr_comp.pdf', transparent=True)
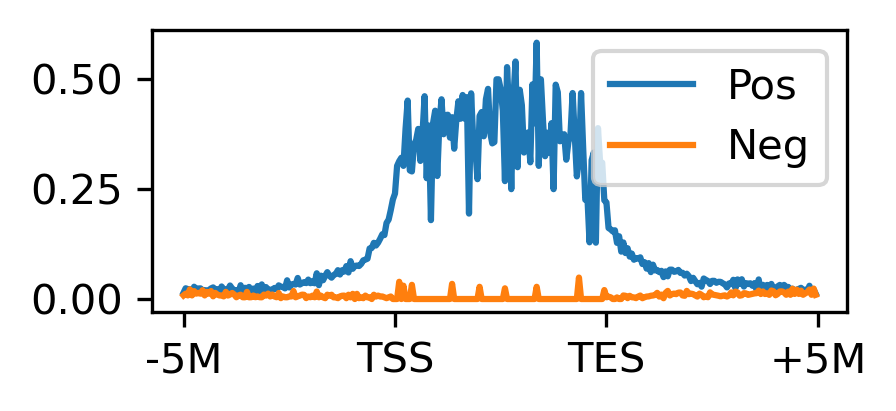
tmp = gene_records.loc[(gene_records['corr']>thres) & (gene_records['TSSdist']>-res) & (gene_records['TESdist']<res), 'gene'].unique()
print(tmp.shape[0], tmp.shape[0]/gene_records['gene'].unique().shape[0])
np.savetxt(f'{outdir}gene_compposcorr_genebody.csv.gz', tmp, delimiter='\n', fmt='%s')

tmp = gene_records.loc[(gene_records['corr']<-thres) & (gene_records['TSSdist']>-res) & (gene_records['TESdist']<res), 'gene'].unique()
print(tmp.shape[0], tmp.shape[0]/gene_records['gene'].unique().shape[0])

tmp = gene_records.loc[(gene_records['corr'].abs()>thres) & (gene_records['TSSdist']>-res) & (gene_records['TESdist']<res), 'gene'].unique()
print(tmp.shape[0], tmp.shape[0]/gene_records['gene'].unique().shape[0])
450 0.4094631483166515
12 0.01091901728844404
462 0.42038216560509556
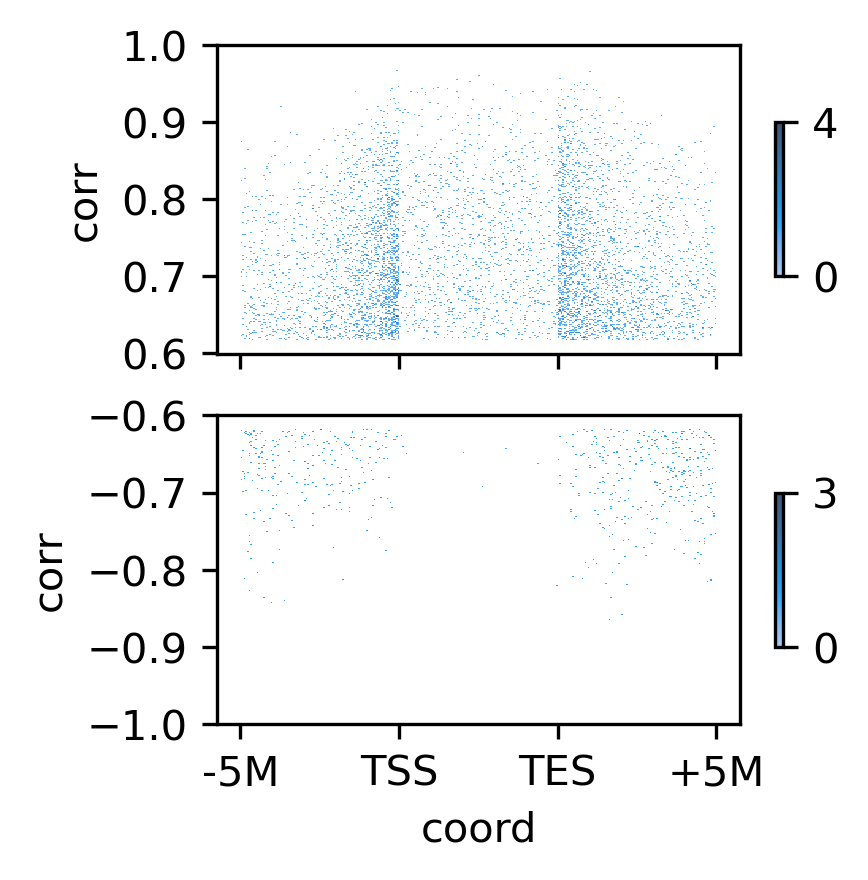
fig, axes = plt.subplots(2, 1, sharex='all', figsize=(3,3), dpi=300)
ax = axes[0]
tmp = gene_records.loc[gene_records['corr']>thres]
sns.histplot(data=tmp, x='coord', y='corr', bins=300, ax=ax, cbar=True, cbar_kws=dict(ticks=[0,4], fraction=0.2, shrink=0.5))
ax.set_yticks(np.arange(0.6, 1.05, 0.1))

ax = axes[1]
tmp = gene_records.loc[gene_records['corr']<-thres]
# tmp = gene_records.loc[gene_records['corr']<-threspos]
sns.histplot(data=tmp, x='coord', y='corr', bins=300, ax=ax, cbar=True, cbar_kws=dict(ticks=[0,3], fraction=0.2, shrink=0.5))
# ax.set_yticks([-0.6, -0.7, -0.8, -0.9])
ax.set_yticks(np.arange(-1.0, -0.55, 0.1))

ax.set_xticks([-300, -100, 100, 300])
ax.set_xticklabels(['-5M', 'TSS', 'TES', '+5M'])

# plt.savefig('DEG_comp_sigcorr.pdf', transparent=True)
[Text(-300, 0, '-5M'),
 Text(-100, 0, 'TSS'),
 Text(100, 0, 'TES'),
 Text(300, 0, '+5M')]