Plot examples#
import os
import cooler
import numpy as np
import pandas as pd
from scipy.stats import norm, zscore

import matplotlib as mpl
import matplotlib.pyplot as plt
from matplotlib.patches import Polygon
from matplotlib import cm as cm
import seaborn as sns
from matplotlib.colors import LogNorm

from itertools import cycle, islice
import xarray as xr
from glob import glob

mpl.style.use('default')
mpl.rcParams['pdf.fonttype'] = 42
mpl.rcParams['ps.fonttype'] = 42
mpl.rcParams['font.family'] = 'sans-serif'
mpl.rcParams['font.sans-serif'] = 'Helvetica'
leg = ['L23_IT', 'L4_IT', 'L5_IT', 'L6_IT', 'L6_IT_Car3', 'L56_NP', 'L6_CT', 'L6b', 'L5_ET', 'Amy',
       'Lamp5', 'Lamp5_LHX6', 'Sncg', 'Vip', 'Pvalb', 'Pvalb_ChC', 'Sst', 'CHD7',
       'MSN_D1', 'MSN_D2', 'Foxp2', 'SubCtx',
       'ASC', 'ODC', 'OPC', 'MGC', 'PC', 'EC', 'VLMC'
      ]
legname = ['L2/3-IT', 'L4-IT', 'L5-IT', 'L6-IT', 'L6-IT-Car3', 'L5/6-NP', 'L6-CT', 'L6b', 'L5-ET', 'Amy-Exc',
       'Lamp5', 'Lamp5-Lhx6', 'Sncg', 'Vip', 'Pvalb', 'Pvalb-ChC', 'Sst', 'Chd7',
       'MSN-D1', 'MSN-D2', 'Foxp2', 'SubCtx-Cplx',
       'ASC', 'ODC', 'OPC', 'MGC', 'PC', 'EC', 'VLMC'
      ]
leg2name = {xx:yy for xx,yy in zip(leg, legname)}
leg = {'exc': ['L23_IT', 'L4_IT', 'L5_IT', 'L6_IT', 'L6_IT_Car3', 'L56_NP', 'L6_CT', 'L6b', 'Amy'],
       'inh': ['Lamp5', 'Lamp5_LHX6', 'Sncg', 'Vip', 'Pvalb', 'Pvalb_ChC', 'Sst', 'CHD7'],
       'msn': ['MSN_D1', 'MSN_D2', 'Foxp2'],
       'sub': ['SubCtx'],
       'glia': ['ASC', 'ODC', 'OPC'],
       'mgc': ['MGC'],
       'smc': ['PC'],
       'endo': ['EC'],
       'fibro': ['VLMC'],
      }
leg['neu'] = leg['exc'] + leg['inh'] + leg['msn'] + leg['sub']
leg['all'] = leg['neu'] + leg['glia'] + leg['mgc'] + leg['smc'] + leg['endo'] + leg['fibro']
leg['cge'] = ['Lamp5', 'Lamp5_LHX6', 'Sncg', 'Vip']
group_name = 'cge'
leg = pd.Index(leg[group_name])
legname = leg.map(leg2name)
res = 25000
indir = '/data/hba/domain_majortype/'
ddir = f'/home/jzhou_salk_edu/sky_workdir/hba/domain_majortype/diff/{group_name}/'
ldir = f'/home/jzhou_salk_edu/sky_workdir/hba/loop_majortype/diff/{group_name}/'
cdir = f'/home/jzhou_salk_edu/sky_workdir/hba/compartment_majortype/diff/{group_name}/'
chrom_size_path = '/home/jzhou_salk_edu/sky_workdir/hba/ref/hg38.main.chrom.sizes'
chrom_sizes = cooler.read_chromsizes(chrom_size_path, all_names=True)
chrom_sizes = chrom_sizes.iloc[:-3]
## Load boundary probability

bound_count_ct = pd.read_hdf(f'{indir}MajorType_boundcount.hdf', key='data').loc[leg]
cell_count_ct = pd.read_csv(f'{indir}MajorType_cellcount.csv.gz', index_col=0, header=0, squeeze=True).loc[leg]
bound_prob_ct = bound_count_ct / cell_count_ct[:,None]
bound_prob_ct
| chr1_0 | chr1_1 | chr1_2 | chr1_3 | chr1_4 | chr1_5 | chr1_6 | chr1_7 | chr1_8 | chr1_9 | ... | chr22_2023 | chr22_2024 | chr22_2025 | chr22_2026 | chr22_2027 | chr22_2028 | chr22_2029 | chr22_2030 | chr22_2031 | chr22_2032 | |
|---|---|---|---|---|---|---|---|---|---|---|---|---|---|---|---|---|---|---|---|---|---|
| Lamp5 | 1.0 | 0.0 | 0.0 | 0.0 | 0.0 | 0.0 | 0.0 | 0.0 | 0.0 | 0.0 | ... | 0.076000 | 0.074000 | 0.084667 | 0.092667 | 0.083333 | 0.062667 | 0.039333 | 0.024000 | 0.033333 | 1.0 |
| Lamp5_LHX6 | 1.0 | 0.0 | 0.0 | 0.0 | 0.0 | 0.0 | 0.0 | 0.0 | 0.0 | 0.0 | ... | 0.075472 | 0.059119 | 0.069182 | 0.077987 | 0.091824 | 0.076730 | 0.031447 | 0.018868 | 0.038994 | 1.0 |
| Sncg | 1.0 | 0.0 | 0.0 | 0.0 | 0.0 | 0.0 | 0.0 | 0.0 | 0.0 | 0.0 | ... | 0.071231 | 0.053942 | 0.085062 | 0.080221 | 0.081604 | 0.060166 | 0.034578 | 0.028354 | 0.032503 | 1.0 |
| Vip | 1.0 | 0.0 | 0.0 | 0.0 | 0.0 | 0.0 | 0.0 | 0.0 | 0.0 | 0.0 | ... | 0.102000 | 0.061333 | 0.064000 | 0.055333 | 0.063333 | 0.052000 | 0.036667 | 0.022000 | 0.035333 | 1.0 |
4 rows × 115009 columns
## Load insulation score

ins_count = xr.open_dataset(f'{indir}MajorType_impute.insulation.nc')
ins_count = ins_count.sel({'bin': (ins_count['bin_chrom']!='chrX')})
ins_count['ratio'] = (ins_count.sel({'type':'inter'})['__xarray_dataarray_variable__'] / ins_count.sel({'type':'intra'}))['__xarray_dataarray_variable__']
ins = ins_count['ratio'].to_pandas().loc[leg]
genemeta = pd.read_csv('/home/jzhou_salk_edu/sky_workdir/hba/ref/gencode.v33.bed', sep='\t', header=None, index_col=4)
genemeta = genemeta[~genemeta.index.duplicated(keep='first')]
gtmp = 'LAMP5'
lslop, rslop = 1000000, 2000000

chrom = genemeta.loc[gtmp, 0]
if genemeta.loc[gtmp, 5]=='+':
    tss = genemeta.loc[gtmp, 1]
    tes = genemeta.loc[gtmp, 2]
else:
    tss = genemeta.loc[gtmp, 2]
    tes = genemeta.loc[gtmp, 1]

ll, rr = (tss - lslop), (tss + rslop)
print(chrom, ll, rr, genemeta.loc[gtmp, 5])
chr20 8514358 11514358 +
## contact maps are plotted at loop resolution
## select region to plot in Q matrix

resl = 10000
loopl, loopr = (ll//resl), (rr//resl)
print(loopl, loopr)
851 1151
indir = '/home/jzhou_salk_edu/sky_workdir/hba/loop_majortype/'
## Load cell type Q

from scipy import ndimage as nd

dstall = []
for ct in leg:
    cool = cooler.Cooler(f'{indir}{ct}/{ct}/{ct}.Q.cool')
    Q = cool.matrix(balance=False, sparse=True).fetch(chrom).tocsr()
    tmp = Q[loopl:loopr, loopl:loopr].toarray()
    dstall.append(tmp)
    print(ct)
Lamp5
Lamp5_LHX6
Sncg
Vip
## select differential loop

loopall = pd.read_hdf(f'{ldir}merged_loop.hdf', key='data')
sell = ((loopall[0]==chrom) &
        (zscore(np.log(loopall['Qanova']))>norm.isf(0.15)) &
        (zscore(np.log(loopall['Tanova']))>norm.isf(0.15)) &
        (loopall[1]>ll) & (loopall[5]<rr))
## select differential boundary

binall = pd.read_hdf(f'{ddir}MajorType_boundary_stats.hdf', key='data')
selb = (binall['chrom']==chrom) & (binall['start']>=ll) & (binall['start']<rr) & binall['bklfilter'] & binall['chi2filter'] & binall['ins_lm'] & (binall['probdiff']>0.05) & binall['diff_sc']
print(selb.sum())
3
ins.columns = binall.index
## select differential compartment

resc = 100000
comp = pd.read_csv(f'{cdir}DifferentialResult/fdr_result/differential.intra_sample_combined.pcQnm.bedGraph', sep='\t', header=0, index_col=None)
comp.index = comp['chr'] + '_' + (comp['start'] // resc).astype(str)
bincomp = comp[['chr', 'start', 'end', 'sample_maha', 'pval', 'padj']]
comp = comp[leg]
selc = (bincomp['chr']==chrom) & (bincomp['start']>=ll) & (bincomp['start']<rr) & (zscore(bincomp['sample_maha'])>norm.isf(0.025))
print(selc.sum())
0
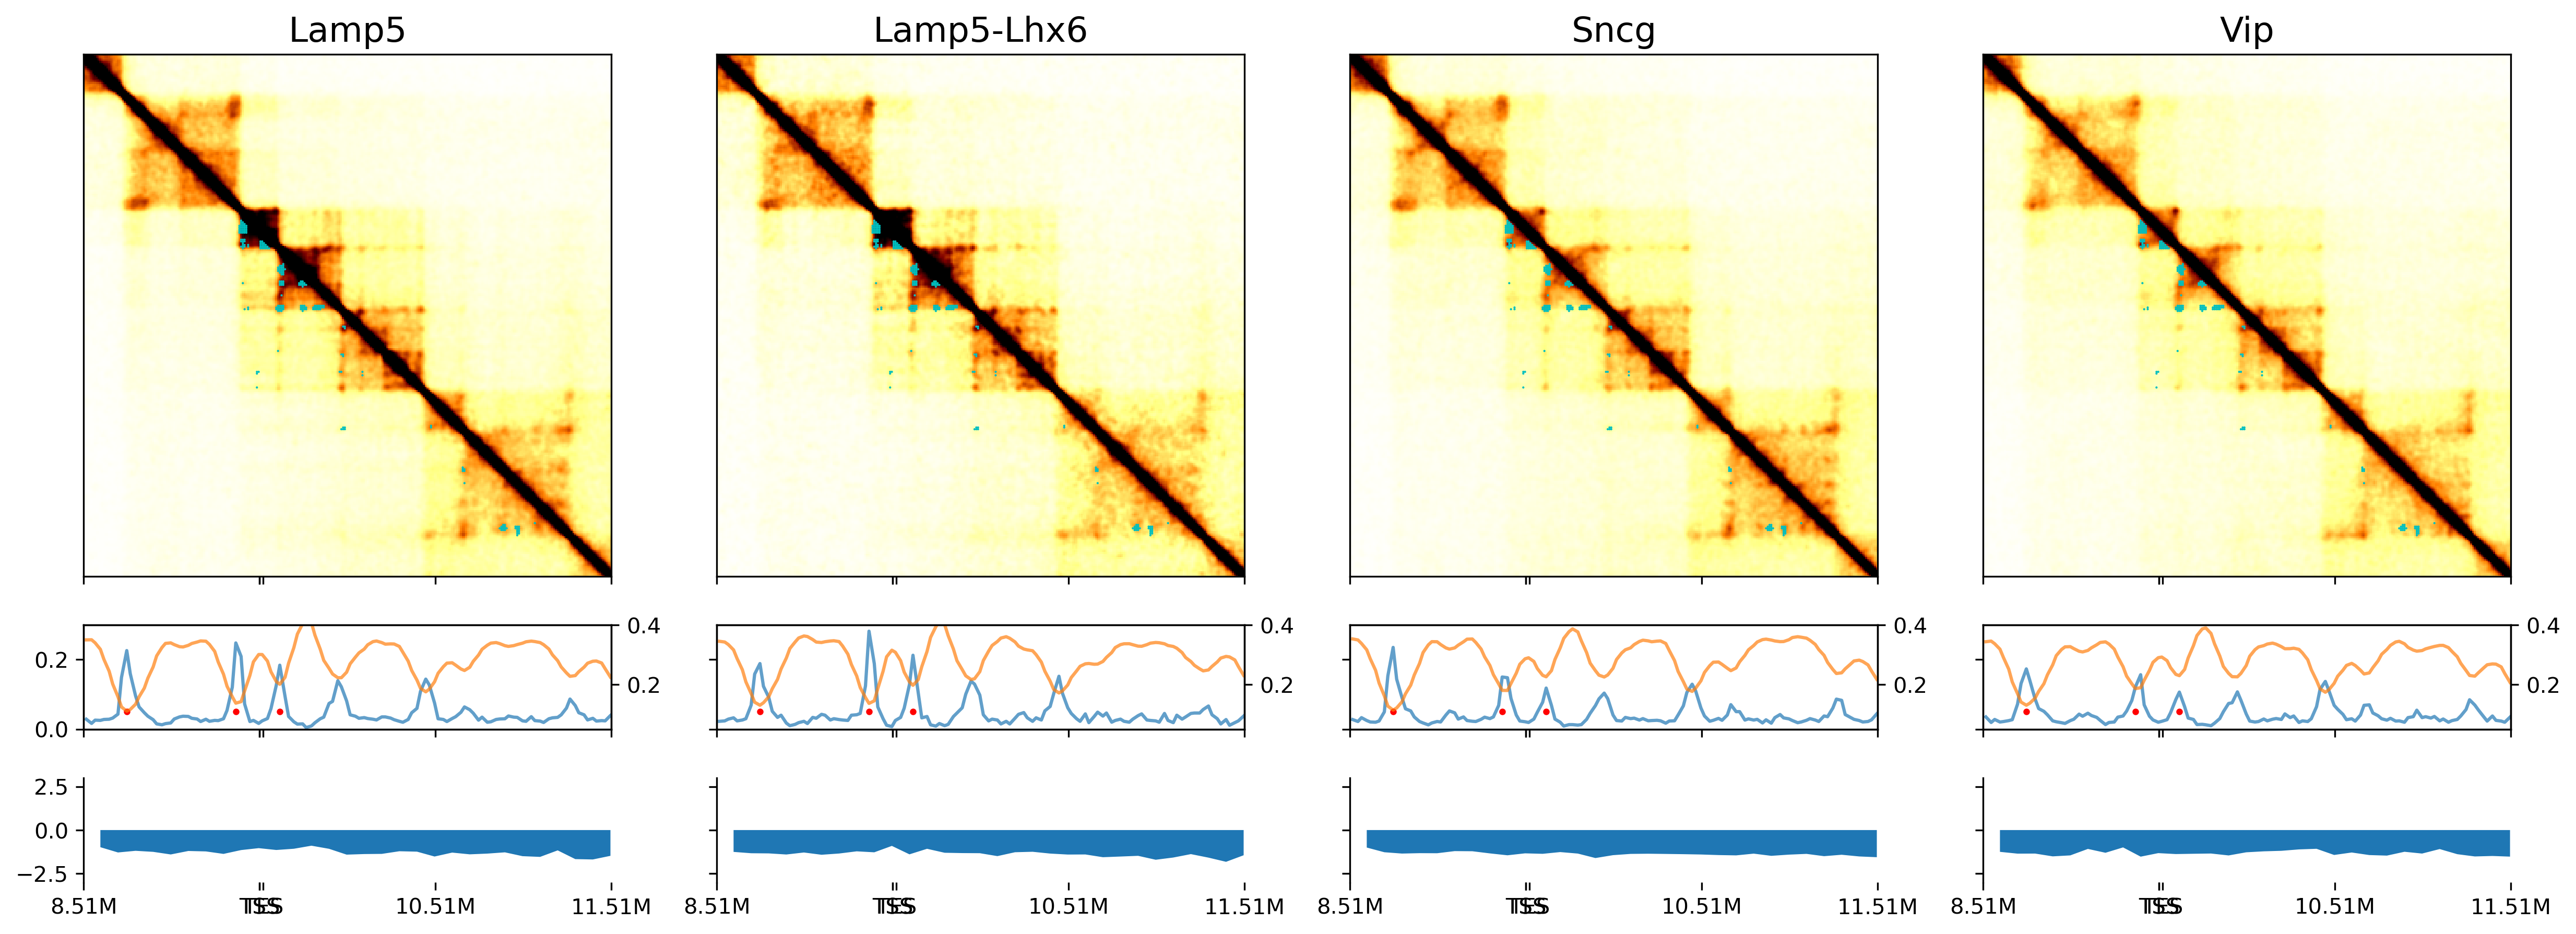
fig, axes = plt.subplots(3, len(leg), figsize=(5*len(leg), 7), sharex='col', sharey='row',
                         gridspec_kw={'height_ratios':[5,1,1]}, dpi=300)

## differential feature position at 10k resolution
tmpl = loopall.loc[sell, [1,4]].values // resl - loopl
tmpd = binall.loc[selb, 'start'] // resl - loopl
tmpc = bincomp.loc[selc, 'start'] // resl - loopl

for i in range(len(leg)):
    ax = axes[0,i]
    ax.axis('equal')
    ax.set_title(legname[i], fontsize=16)
    img = ax.imshow(dstall[i], cmap='afmhot_r', vmin=0, vmax=0.012, aspect='auto')
    ax.set_yticks([])
    ax.set_yticklabels([])
    ax.set_xticklabels([])
    ## plot diff loop
    ax.scatter(tmpl[:, 0], tmpl[:, 1], alpha=1, s=1, marker='o', edgecolors='none', color='c')

    ax = axes[1,i]
    ## plot boundary prob, use 10k coordinate
    sel = (binall['chrom']==chrom) & (binall['start']>=ll) & (binall['start']<rr)
    ax.plot(binall.loc[sel, 'start'] // resl - loopl,
            bound_prob_ct.loc[leg[i], sel].values,
            c='C0', alpha=0.7)
    ## plot diff boundary
    ax.scatter(tmpd, np.zeros(len(tmpd))+0.05, color='r', s=4)
    ax.set_ylim([0, 0.3])
    ax2 = ax.twinx()
    ## plot insulation score, use 10k coordinate
    ax2.plot(binall.loc[sel, 'start'] // resl - loopl,
             ins.loc[leg[i], sel].values,
             c='C1', alpha=0.7)
    ax2.set_ylim([0.05, 0.4])
    ax.set_xlim([0, loopr-loopl-1])
    ax.set_xticks(np.arange(0, loopr-loopl+1, 100).tolist() + [tss//resl-loopl, tes//resl-loopl])
    ax.set_xticklabels([])

    ax = axes[2,i]
    sns.despine(bottom=True, ax=ax)
    ## plot compartment, use 10k coordinate
    sel = (bincomp['chr']==chrom) & (bincomp['start']>=ll) & (bincomp['start']<rr)
    x = bincomp.loc[sel, 'start'] // resl - loopl
    y = comp.loc[sel, leg[i]].values
    ax.fill_between(x, y, 0, where=y >= 0, facecolor='C3', interpolate=True)
    ax.fill_between(x, y, 0, where=y <= 0, facecolor='C0', interpolate=True)
    ## plot diff comp
    ax.scatter(tmpc, np.zeros(len(tmpc)), color='r', s=4)
    ax.set_ylim([-3, 3])
    ax.set_xlim([-0.5, loopr-loopl-0.5])
    ax.set_xticks(np.arange(-0.5, loopr-loopl, 100).tolist() + [tss//resl-loopl-0.5, tes//resl-loopl-0.5])
    ax.set_xticklabels([])
    ax.set_xticklabels([f'{(xx+loopl)/100}M' for xx in np.arange(0, loopr-loopl+1, 100)]+['TSS','TES'])

# plt.savefig(f'{group_name}_diff_{gtmp}.pdf', transparent=True, dpi=300)
dstall = []
for ct in leg:
    cool = cooler.Cooler(f'{indir}{ct}/{ct}/{ct}.Q.cool')
    Q = cool.matrix(balance=False, sparse=True).fetch(chrom).tocsr()
    tmp = Q[loopl:loopr, loopl:loopr].toarray()
    dst = nd.rotate(tmp, 45, order=0, reshape=True, prefilter=False, cval=0)
    dstall.append(dst)
    print(ct)
Lamp5
Lamp5_LHX6
Sncg
Vip
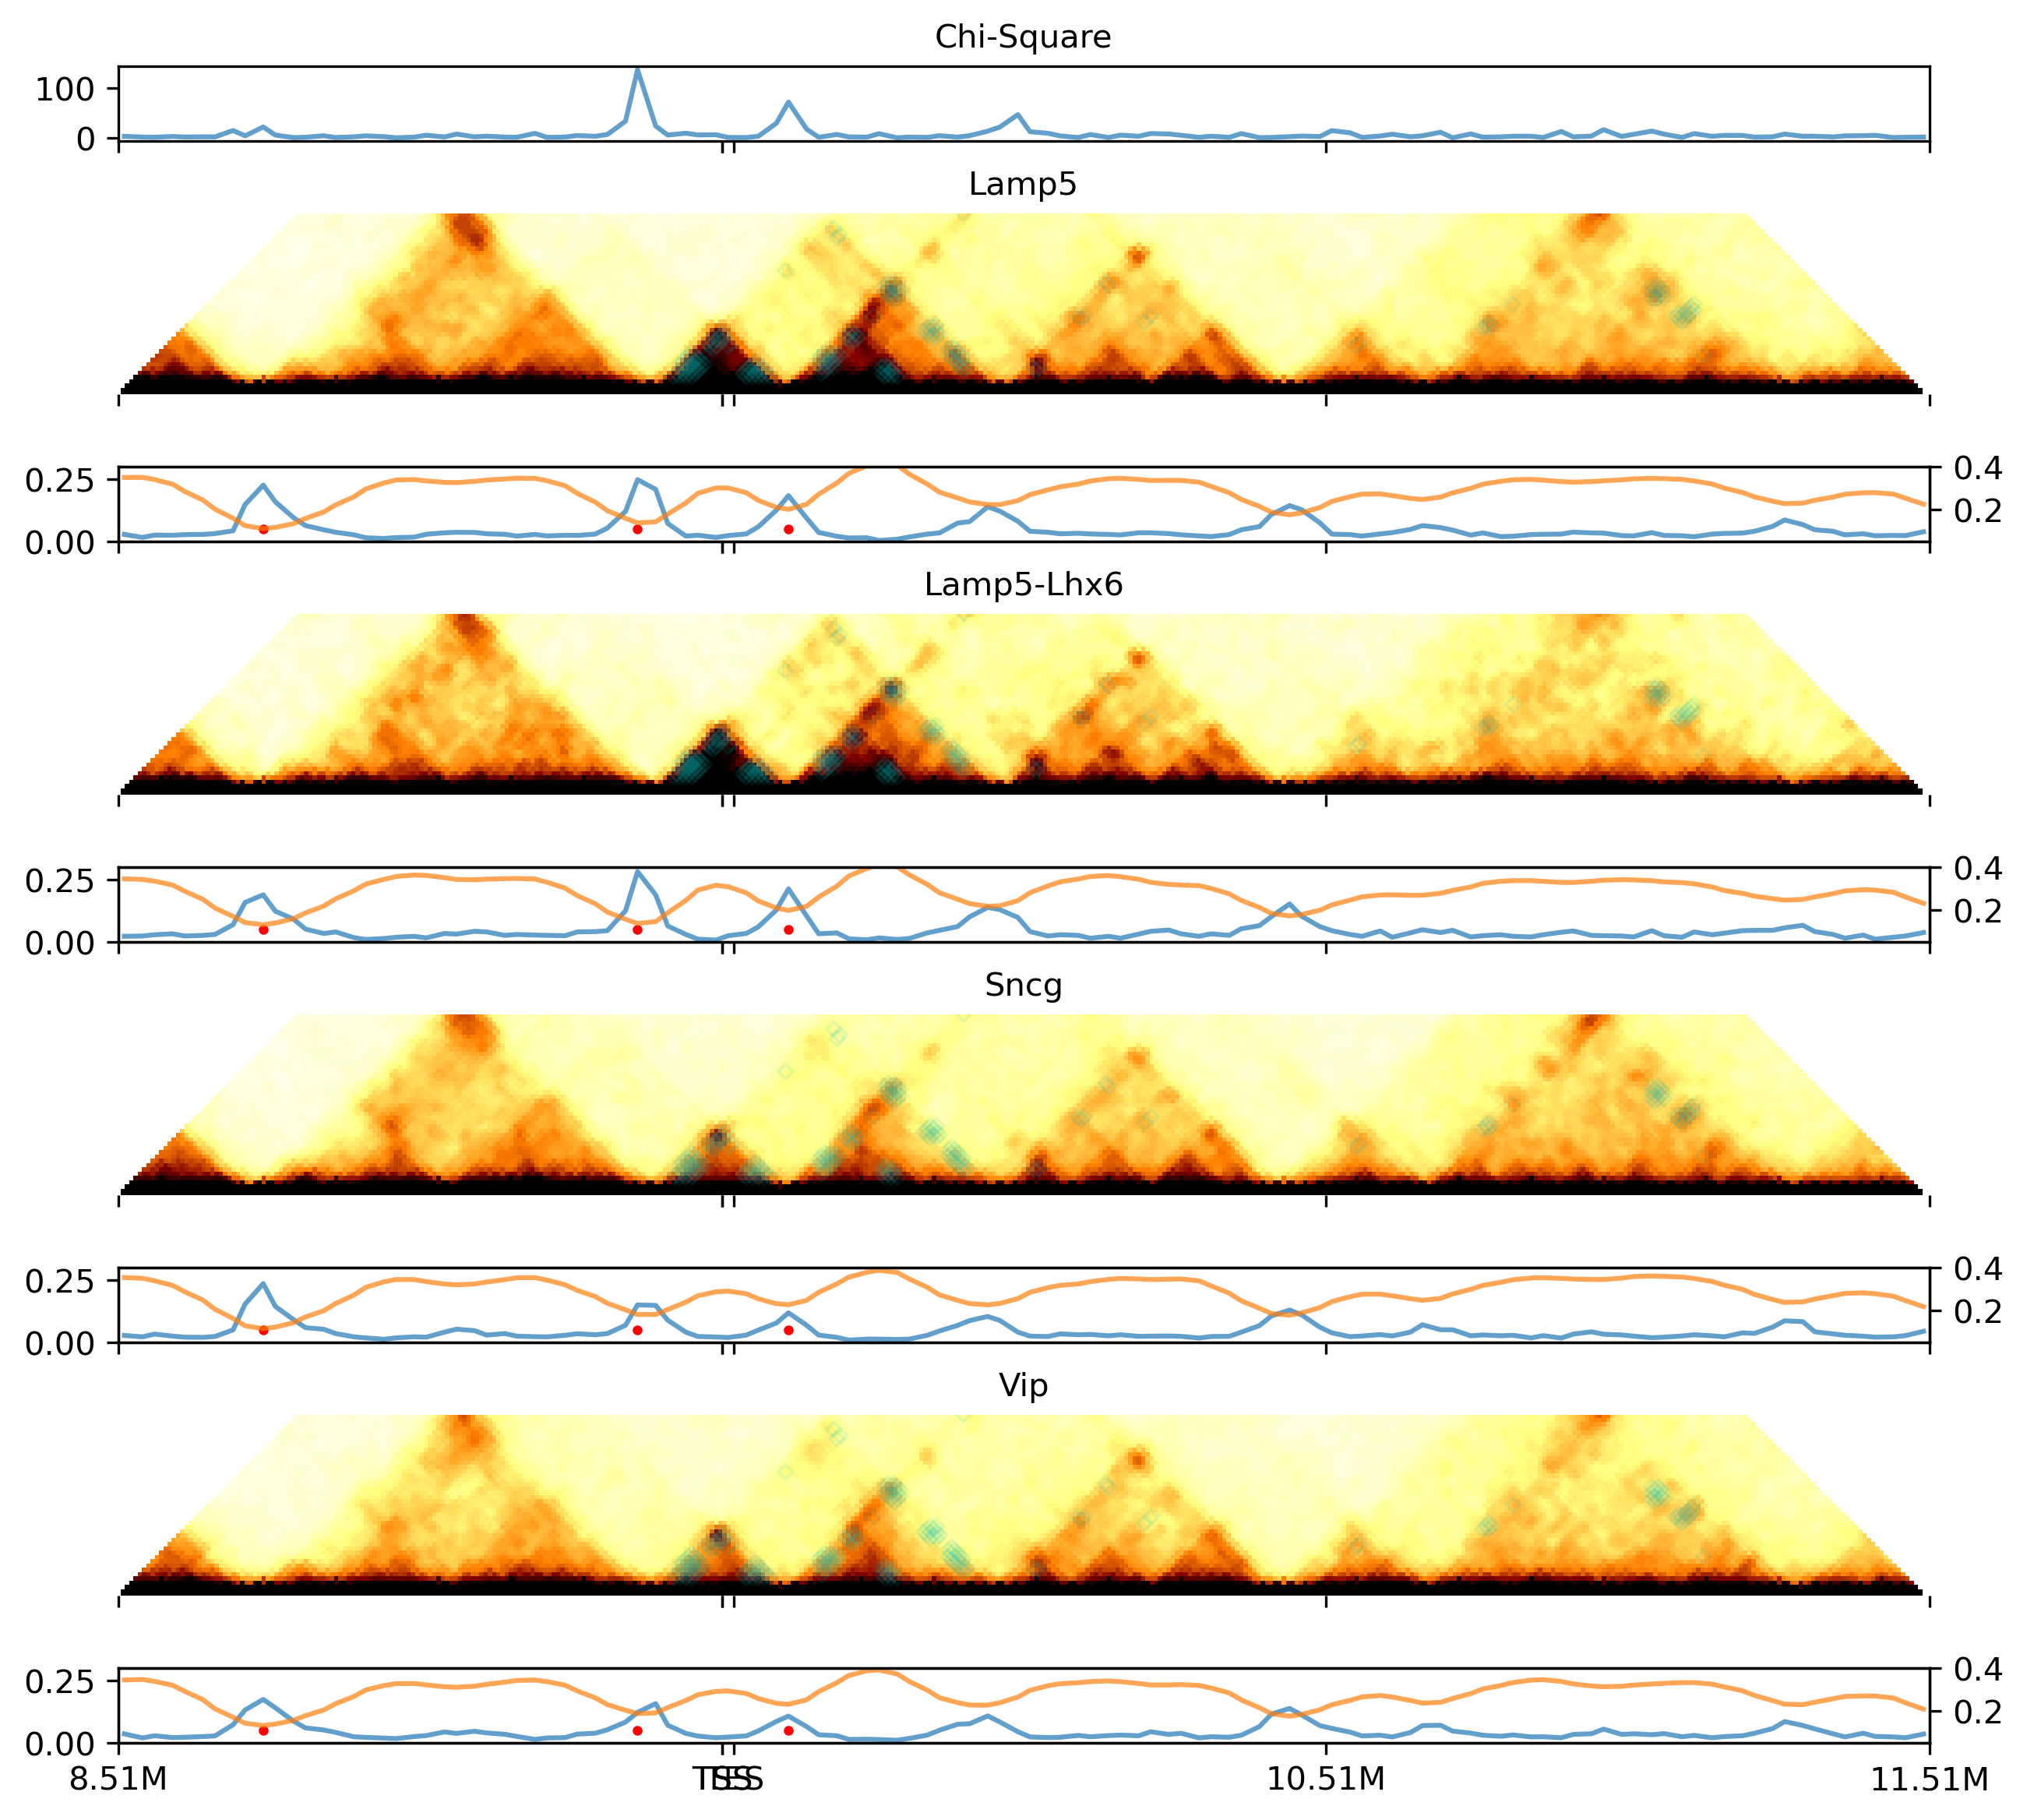
fig, axes = plt.subplots(len(leg)*2+1, 1, figsize=(10, np.sum([1] + np.tile([3.5,1],len(leg)).tolist())/2),
                         gridspec_kw={'height_ratios':[1] + np.tile([3.5,1],len(leg)).tolist()}, dpi=300, sharex='all')

tmpl = loopall.loc[sell, [1,4]].values // resl - loopl
tmpd = binall.loc[selb, 'start'] // resl - loopl
tmpc = bincomp.loc[selc, 'start'] // resl - loopl

ax = axes[0]
sel = (binall['chrom']==chrom) & (binall['start']>=ll) & (binall['start']<rr)
xpos = (binall.loc[sel, 'start'] // resl - loopl) * np.sqrt(2)
ax.plot(xpos, binall.loc[sel, 'chi2_sc'].values,
        c='C0', alpha=0.7)

ax.set_title('Chi-Square', fontsize=10)
ax.set_xlim([0, (loopr-loopl-1)*np.sqrt(2)])

for i in range(len(leg)):
    ax = axes[i*2+1]
    ax.set_title(legname[i], fontsize=10)
    ax.spines['right'].set_visible(False)
    ax.spines['top'].set_visible(False)
    ax.spines['bottom'].set_visible(False)
    ax.spines['left'].set_visible(False)
    img = ax.imshow(dstall[i], cmap='afmhot_r', vmin=0, vmax=0.012)
    h = len(dstall[i])
    ax.set_ylim([0.5*h, 0.4*h])
    ax.set_xlim([0, h])
    ax.set_yticks([])
    ax.set_yticklabels([])
    ax.scatter((tmpl[:, 0]+tmpl[:, 1])/np.sqrt(2), 0.5*h-(tmpl[:, 1]-tmpl[:, 0])/np.sqrt(2),
           alpha=0.1, s=10, marker='D', edgecolors='c', color='none')

    ax = axes[i*2+2]
    ax.plot(xpos, bound_prob_ct.loc[leg[i], sel].values, c='C0', alpha=0.7)
    ax.scatter(tmpd * np.sqrt(2), np.zeros(len(tmpd))+0.05, color='r', s=4)
    ax.set_ylim([0, 0.3])
    ax2 = ax.twinx()
    ax2.plot(xpos, ins.loc[leg[i], sel].values, c='C1', alpha=0.7)
    ax2.set_ylim([0.05, 0.4])

ax.set_xlim([0, (loopr-loopl-1)*np.sqrt(2)])
ax.set_xticks(np.sqrt(2)*np.array(np.arange(0, loopr-loopl+1, 100).tolist() + [tss//resl-loopl, tes//resl-loopl]))
ax.set_xticklabels([])
ax.set_xticklabels([f'{(xx+loopl)/100}M' for xx in np.arange(0, loopr-loopl+1, 100)]+['TSS','TES'])

# plt.savefig(f'/gale/netapp/entex/HBA/snm3C/plot/majortype_diff_FOXP2.pdf', transparent=True, dpi=300)
[Text(0.0, 0, '8.51M'),
 Text(141.4213562373095, 0, 'TSS'),
 Text(282.842712474619, 0, '10.51M'),
 Text(424.26406871192853, 0, '11.51M'),
 Text(141.4213562373095, 0, 'TSS'),
 Text(144.2497833620557, 0, 'TES')]