Correlation between compartment and other modalities#
import cooler
import numpy as np
import pandas as pd
import matplotlib as mpl
import matplotlib.pyplot as plt
from matplotlib.colors import LogNorm
from matplotlib import cm as cm
import seaborn as sns
from scipy.stats import zscore, pearsonr, norm

mpl.style.use('default')
mpl.rcParams['pdf.fonttype'] = 42
mpl.rcParams['ps.fonttype'] = 42
mpl.rcParams['font.family'] = 'sans-serif'
mpl.rcParams['font.sans-serif'] = 'Helvetica'
leg = ['L23_IT', 'L4_IT', 'L5_IT', 'L6_IT', 'L6_IT_Car3', 'L56_NP', 'L6_CT', 'L6b', 'L5_ET', 'Amy',
       'Lamp5', 'Lamp5_LHX6', 'Sncg', 'Vip', 'Pvalb', 'Pvalb_ChC', 'Sst', 'CHD7',
       'MSN_D1', 'MSN_D2', 'Foxp2', 'SubCtx',
       'ASC', 'ODC', 'OPC', 'MGC', 'PC', 'EC', 'VLMC'
      ]
legname = ['L2/3-IT', 'L4-IT', 'L5-IT', 'L6-IT', 'L6-IT-Car3', 'L5/6-NP', 'L6-CT', 'L6b', 'L5-ET', 'Amy-Exc',
       'Lamp5', 'Lamp5-Lhx6', 'Sncg', 'Vip', 'Pvalb', 'Pvalb-ChC', 'Sst', 'Chd7',
       'MSN-D1', 'MSN-D2', 'Foxp2', 'SubCtx-Cplx',
       'ASC', 'ODC', 'OPC', 'MGC', 'PC', 'EC', 'VLMC'
      ]
leg2name = {xx:yy for xx,yy in zip(leg, legname)}
leg = {'exc': ['L23_IT', 'L4_IT', 'L5_IT', 'L6_IT', 'L6_IT_Car3', 'L56_NP', 'L6_CT', 'L6b', 'Amy'],
       'inh': ['Lamp5', 'Lamp5_LHX6', 'Sncg', 'Vip', 'Pvalb', 'Pvalb_ChC', 'Sst', 'CHD7'],
       'msn': ['MSN_D1', 'MSN_D2', 'Foxp2'],
       'sub': ['SubCtx'],
       'glia': ['ASC', 'ODC', 'OPC'],
       'mgc': ['MGC'],
       'smc': ['PC'],
       'endo': ['EC'],
       'fibro': ['VLMC'],
      }
leg['neu'] = leg['exc'] + leg['inh'] + leg['msn'] + leg['sub']
leg['all'] = leg['neu'] + leg['glia'] + leg['mgc'] + leg['smc'] + leg['endo'] + leg['fibro']
group_name = 'neu'
leg = pd.Index(leg[group_name])
legname = leg.map(leg2name)
res = 100000
indir = f'/home/jzhou_salk_edu/sky_workdir/hba/compartment_majortype/diff/{group_name}/'
comp = pd.read_csv(f'{indir}DifferentialResult/fdr_result/differential.intra_sample_combined.pcQnm.bedGraph', sep='\t', header=0, index_col=None)
comp.index = comp['chr'] + '_' + (comp['start'] // res).astype(str)
comp
| chr | start | end | L23_IT_100Kb | L4_IT_100Kb | L5_IT_100Kb | L6_IT_100Kb | L6_IT_Car3_100Kb | L56_NP_100Kb | L6_CT_100Kb | ... | Sst | CHD7 | MSN_D1 | MSN_D2 | Foxp2 | SubCtx | sample_maha | pval | padj | dist_clust | |
|---|---|---|---|---|---|---|---|---|---|---|---|---|---|---|---|---|---|---|---|---|---|
| chr10_2 | chr10 | 200000 | 300000 | 1.20141 | 1.40148 | 1.12274 | 0.91856 | 0.71971 | 1.45364 | 1.35924 | ... | 1.60003 | 1.79399 | 1.18581 | 1.14140 | 1.64998 | 1.77294 | 78.797991 | 6.274326e-09 | 1.654675e-08 | 1 |
| chr10_3 | chr10 | 300000 | 400000 | 1.67618 | 1.43001 | 1.33450 | 1.32691 | 0.51945 | 1.22911 | 1.53759 | ... | 1.69831 | 1.69831 | 1.61143 | 1.15231 | 1.94190 | 2.06830 | 101.685104 | 6.282661e-13 | 1.940153e-12 | 1 |
| chr10_4 | chr10 | 400000 | 500000 | 1.27442 | 1.33094 | 1.21215 | 1.43974 | 0.96214 | 1.59233 | 1.40148 | ... | 1.58100 | 1.61143 | 1.64171 | 1.62984 | 1.69065 | 1.68152 | 28.864611 | 9.045962e-02 | 1.563036e-01 | 1 |
| chr10_5 | chr10 | 500000 | 600000 | 1.43001 | 1.39806 | 1.69428 | 1.60003 | 0.57439 | 1.61143 | 1.37993 | ... | 1.76052 | 1.79952 | 1.58100 | 1.83248 | 1.55484 | 2.17604 | 110.773702 | 1.418987e-14 | 4.640257e-14 | 1 |
| chr10_6 | chr10 | 600000 | 700000 | 1.43350 | 1.69065 | 1.44978 | 1.66232 | 1.23573 | 1.26750 | 1.73916 | ... | 1.90078 | 1.82624 | 1.85399 | 1.42406 | 1.60286 | 1.35578 | 8.253318 | 9.900547e-01 | 1.000000e+00 | 1 |
| ... | ... | ... | ... | ... | ... | ... | ... | ... | ... | ... | ... | ... | ... | ... | ... | ... | ... | ... | ... | ... | ... |
| chr9_1367 | chr9 | 136700000 | 136800000 | 2.53781 | 2.49765 | 2.43707 | 2.53781 | 2.64364 | 2.50284 | 2.61332 | ... | 2.49765 | 2.30178 | 2.55214 | 2.61332 | 2.42730 | 2.37386 | 0.208439 | 1.000000e+00 | 1.000000e+00 | 1 |
| chr9_1368 | chr9 | 136800000 | 136900000 | 2.25818 | 2.34290 | 2.30178 | 2.27476 | 2.20722 | 2.28698 | 2.49765 | ... | 2.35196 | 2.29048 | 2.25515 | 2.25515 | 2.17299 | 2.22961 | 1.756256 | 1.000000e+00 | 1.000000e+00 | 1 |
| chr9_1369 | chr9 | 136900000 | 137000000 | 2.26494 | 2.13128 | 2.34837 | 2.37084 | 2.33576 | 2.35196 | 2.46547 | ... | 2.39138 | 2.22605 | 2.35521 | 2.31751 | 2.40634 | 2.33914 | 0.318975 | 1.000000e+00 | 1.000000e+00 | 1 |
| chr9_1370 | chr9 | 137000000 | 137100000 | 2.35196 | 2.04449 | 2.36778 | 2.18888 | 2.30471 | 2.28174 | 2.42333 | ... | 2.35761 | 2.25818 | 2.30178 | 2.18888 | 2.30759 | 2.36778 | 0.952000 | 1.000000e+00 | 1.000000e+00 | 1 |
| chr9_1372 | chr9 | 137200000 | 137300000 | 2.33276 | 2.13811 | 2.29494 | 2.32970 | 2.46547 | 2.41199 | 2.52050 | ... | 2.46547 | 2.46252 | 2.38687 | 2.35196 | 2.32339 | 2.21984 | 0.170553 | 1.000000e+00 | 1.000000e+00 | 1 |
24745 rows × 49 columns
binall = comp[['chr', 'start', 'end', 'sample_maha', 'pval', 'padj']]
comp = comp[leg]
from ALLCools.mcds import MCDS
from ALLCools.mcds.utilities import calculate_posterior_mc_frac
mcds = MCDS.open('/data/hba/mc_majortype/MajorType.mcds', var_dim='chrom5k')
mcds['chrom100k'] = mcds['chrom5k_chrom'].to_pandas().astype(str) + '_' + (mcds['chrom5k_start'] // res).to_pandas().astype(str)
mcds
<xarray.MCDS>
Dimensions:        (cell: 40, chrom5k: 617669, count_type: 2, mc_type: 2)
Coordinates:
  * cell           (cell) <U10 'Amy' 'ASC' 'CA1' 'CA2' ... 'THM_MB' 'Vip' 'VLMC'
  * chrom5k        (chrom5k) object 'chr1_0' 'chr1_1' ... 'chrY_11445'
    chrom5k_chrom  (chrom5k) <U5 'chr1' 'chr1' 'chr1' ... 'chrY' 'chrY' 'chrY'
    chrom5k_end    (chrom5k) int64 5000 10000 15000 ... 57225000 57227415
    chrom5k_start  (chrom5k) int64 0 5000 10000 ... 57215000 57220000 57225000
  * count_type     (count_type) <U3 'mc' 'cov'
  * mc_type        (mc_type) <U3 'CGN' 'CHN'
Data variables:
    chrom5k_da     (cell, chrom5k, mc_type, count_type) uint32 dask.array<chunksize=(5, 77209, 1, 1), meta=np.ndarray>
    chrom100k      (chrom5k) object 'chr1_0' 'chr1_0' ... 'chrY_572' 'chrY_572'
Attributes:
    obs_dim:  cell
var_dim: chrom5kmCG#
mc = mcds['chrom5k_da'].sel(count_type='mc', mc_type='CGN').to_pandas().T
mc['chrom100k'] = mcds['chrom100k'].to_pandas()
mc = mc.groupby('chrom100k').sum().T
cov = mcds['chrom5k_da'].sel(count_type='cov', mc_type='CGN').to_pandas().T
cov['chrom100k'] = mcds['chrom100k'].to_pandas()
cov = cov.groupby('chrom100k').sum().T
binfilter = ['_'.join(xx.split('_')[:-1]) for xx in mc.columns]
binfilter = [(len(xx)<6) and (xx not in ['chrM','chrX','chrY']) for xx in binfilter]
print(np.sum(binfilter))
mc = mc.loc[leg, binfilter]
cov = cov.loc[leg, binfilter]
print(mc.shape, cov.shape)
28760
(21, 28760) (21, 28760)
mcg = calculate_posterior_mc_frac(mc.values, cov.values)
mcg = pd.DataFrame(mcg, index=leg, columns=mc.columns)
mcg = mcg[binall.index].T
mCH#
mc = mcds['chrom5k_da'].sel(count_type='mc', mc_type='CHN').to_pandas().T
mc['chrom100k'] = mcds['chrom100k'].to_pandas()
mc = mc.groupby('chrom100k').sum().T
cov = mcds['chrom5k_da'].sel(count_type='cov', mc_type='CHN').to_pandas().T
cov['chrom100k'] = mcds['chrom100k'].to_pandas()
cov = cov.groupby('chrom100k').sum().T
binfilter = ['_'.join(xx.split('_')[:-1]) for xx in mc.columns]
binfilter = [(len(xx)<6) and (xx not in ['chrM','chrX','chrY']) for xx in binfilter]
print(np.sum(binfilter))
mc = mc.loc[leg, binfilter]
cov = cov.loc[leg, binfilter]
print(mc.shape, cov.shape)
28760
(21, 28760) (21, 28760)
mch = calculate_posterior_mc_frac(mc.values, cov.values)
mch = pd.DataFrame(mch, index=leg, columns=mc.columns)
mch = mch[binall.index].T
ATAC#
sig = pd.read_hdf('/home/jzhou_salk_edu/sky_workdir/hba/atac_majortype/cluster_atac_signal.hdf')
cov = pd.read_hdf('/home/jzhou_salk_edu/sky_workdir/hba/atac_majortype/cluster_atac_cov.hdf')
bins = pd.DataFrame(index=sig.columns)
bins['chrom'] = bins.index.str.split('_').str[0]
bins['start'] = (bins.index.str.split('_').str[1].astype(int) - 1) * 5000
bins['chrom100k'] = bins['chrom'] + '_' + (bins['start'] // res).astype(str)
sig = sig.groupby(by=bins['chrom100k'], axis=1).sum()
cov = cov.groupby(by=bins['chrom100k']).sum()
atac = (sig/cov).fillna(0)
legatac = leg[leg.isin(atac.index)]
atac = atac.loc[legatac, binall.index].T
atac = atac / atac.sum(axis=0)
outdir = './'
mcg.to_hdf(f'{outdir}comp_mCG.hdf', key='data')
mch.to_hdf(f'{outdir}comp_mCH.hdf', key='data')
atac.to_hdf(f'{outdir}comp_ATAC.hdf', key='data')
binall['mCG_corr'] = [pearsonr(xx, yy)[0] for xx,yy in zip(comp.values, mcg.values)]
binall['mCH_corr'] = [pearsonr(xx, yy)[0] for xx,yy in zip(comp.values, mch.values)]
if atac.shape[1]==comp.shape[1]:
    binall['ATAC_corr'] = [pearsonr(xx, yy)[0] for xx,yy in zip(comp.values, atac.values)]
binall['logPadj'] = -np.log10(binall['padj'])
binall.loc[binall['logPadj']>300, 'logPadj'] = 300
binall['mCG_std'] = np.std(mcg, axis=1)
binall['mCH_std'] = np.std(mch, axis=1)
binall['ATAC_std'] = np.std(atac, axis=1)
binall['comp_std'] = np.std(comp, axis=1)
binall
| chr | start | end | sample_maha | pval | padj | mCG_corr | mCH_corr | ATAC_corr | logPadj | mCG_std | mCH_std | ATAC_std | comp_std | |
|---|---|---|---|---|---|---|---|---|---|---|---|---|---|---|
| chr10_2 | chr10 | 200000 | 300000 | 78.797991 | 6.274326e-09 | 1.654675e-08 | 0.189020 | -0.307897 | 0.083061 | 7.781287 | 0.020524 | 0.069741 | 0.000007 | 0.372115 |
| chr10_3 | chr10 | 300000 | 400000 | 101.685104 | 6.282661e-13 | 1.940153e-12 | 0.287263 | -0.255900 | -0.157650 | 11.712164 | 0.032419 | 0.084277 | 0.000013 | 0.345404 |
| chr10_4 | chr10 | 400000 | 500000 | 28.864611 | 9.045962e-02 | 1.563036e-01 | -0.492743 | -0.395472 | 0.361907 | 0.806031 | 0.028772 | 0.080842 | 0.000012 | 0.285201 |
| chr10_5 | chr10 | 500000 | 600000 | 110.773702 | 1.418987e-14 | 4.640257e-14 | -0.021354 | -0.314666 | 0.287532 | 13.333458 | 0.034190 | 0.098258 | 0.000012 | 0.322221 |
| chr10_6 | chr10 | 600000 | 700000 | 8.253318 | 9.900547e-01 | 1.000000e+00 | -0.100094 | -0.142201 | 0.179416 | -0.000000 | 0.040324 | 0.077744 | 0.000017 | 0.236699 |
| ... | ... | ... | ... | ... | ... | ... | ... | ... | ... | ... | ... | ... | ... | ... |
| chr9_1367 | chr9 | 136700000 | 136800000 | 0.208439 | 1.000000e+00 | 1.000000e+00 | -0.064657 | 0.237518 | 0.096892 | -0.000000 | 0.023485 | 0.057986 | 0.000010 | 0.094490 |
| chr9_1368 | chr9 | 136800000 | 136900000 | 1.756256 | 1.000000e+00 | 1.000000e+00 | 0.344439 | 0.447092 | -0.465422 | -0.000000 | 0.041249 | 0.046669 | 0.000012 | 0.119900 |
| chr9_1369 | chr9 | 136900000 | 137000000 | 0.318975 | 1.000000e+00 | 1.000000e+00 | 0.525077 | 0.260201 | -0.377476 | -0.000000 | 0.028921 | 0.059762 | 0.000011 | 0.095886 |
| chr9_1370 | chr9 | 137000000 | 137100000 | 0.952000 | 1.000000e+00 | 1.000000e+00 | 0.361288 | 0.461071 | -0.361203 | -0.000000 | 0.042212 | 0.047043 | 0.000013 | 0.119908 |
| chr9_1372 | chr9 | 137200000 | 137300000 | 0.170553 | 1.000000e+00 | 1.000000e+00 | 0.490722 | 0.239300 | -0.064113 | -0.000000 | 0.014158 | 0.042930 | 0.000012 | 0.098449 |
24745 rows × 14 columns
binall.to_hdf(f'{outdir}bin_stats.hdf', key='data')
fig, axes = plt.subplots(1, 2, figsize=(4, 2), dpi=300)
ax = axes[0]
sns.histplot(zscore(np.log10(binall['sample_maha'])), bins=100, ax=ax)
ax = axes[1]
sns.histplot(zscore(binall['sample_maha']), bins=100, binrange=(-1,3), ax=ax)
plt.tight_layout()
findfont: Font family ['sans-serif'] not found. Falling back to DejaVu Sans.
findfont: Generic family 'sans-serif' not found because none of the following families were found: Helvetica
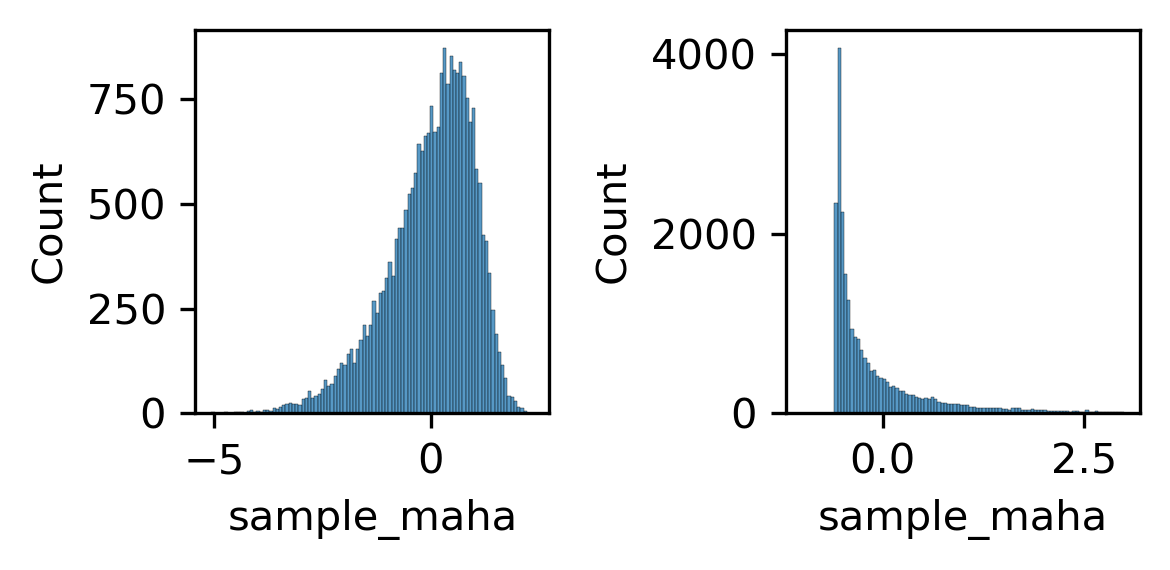
print(np.sum(zscore(binall['sample_maha'])>norm.isf(0.025)))
1024
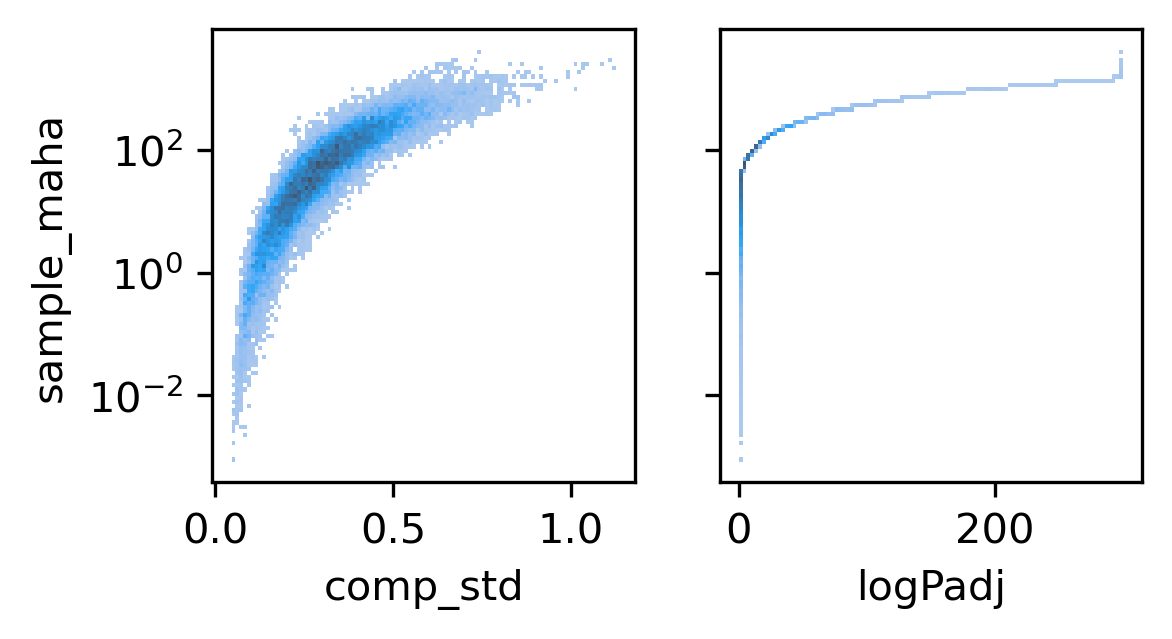
fig, axes = plt.subplots(1, 2, figsize=(4,2), sharey='all', dpi=300)
ax = axes[0]
sns.histplot(binall, x='comp_std', y='sample_maha', bins=100, ax=ax, log_scale=(False, 10))
ax = axes[1]
sns.histplot(binall, x='logPadj', y='sample_maha', bins=100, ax=ax, log_scale=(False, 10))
<AxesSubplot:xlabel='logPadj', ylabel='sample_maha'>
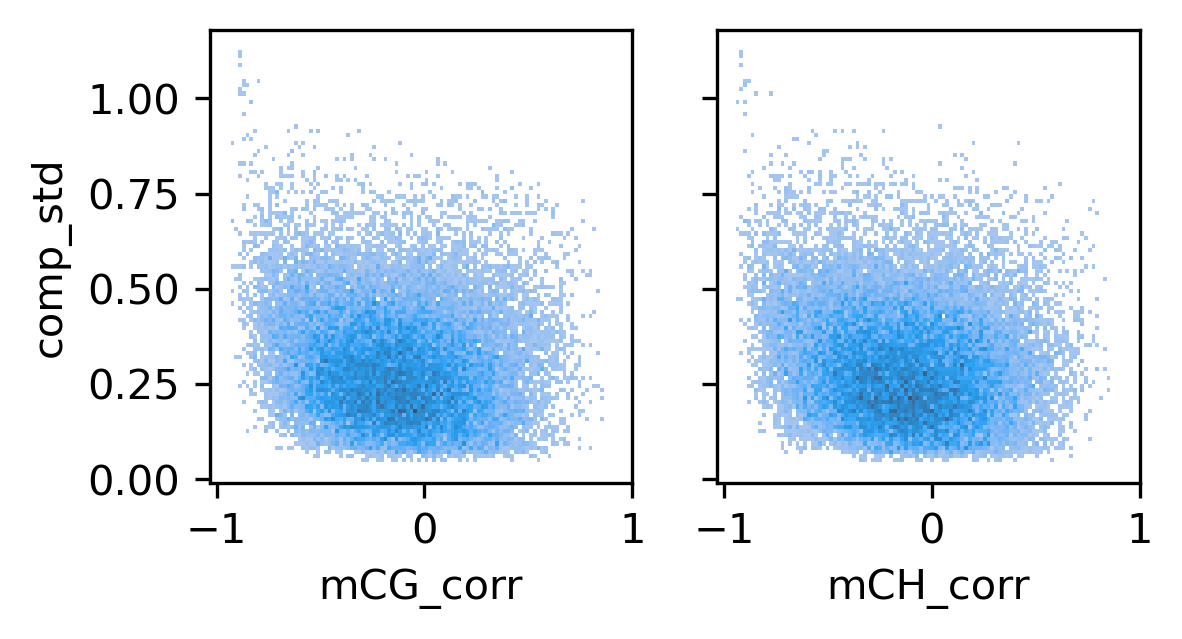
fig, axes = plt.subplots(1, 2, figsize=(4,2), sharex='all', sharey='all', dpi=300)
ax = axes[0]
sns.histplot(binall, x='mCG_corr', y='comp_std', bins=100, ax=ax)
ax = axes[1]
sns.histplot(binall, x='mCH_corr', y='comp_std', bins=100, ax=ax)
ax.set_xticks([-1, 0, 1])
# plt.savefig(f'majortype_{group_name}_diffcomp_stdcorr.pdf', transparent=True)
[<matplotlib.axis.XTick at 0x7f509c6ad690>,
 <matplotlib.axis.XTick at 0x7f509c6a8390>,
 <matplotlib.axis.XTick at 0x7f509c64e190>]
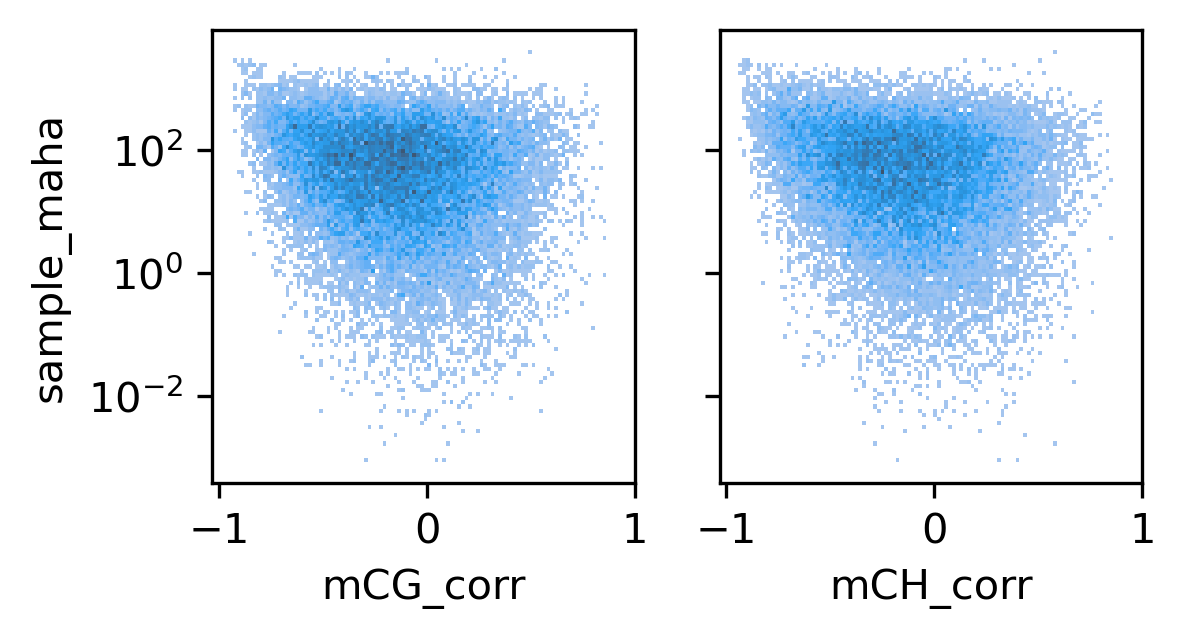
fig, axes = plt.subplots(1, 2, figsize=(4,2), sharex='all', sharey='all', dpi=300)
ax = axes[0]
sns.histplot(binall, x='mCG_corr', y='sample_maha', bins=100, log_scale=(False, 10), ax=ax)
ax = axes[1]
sns.histplot(binall, x='mCH_corr', y='sample_maha', bins=100, log_scale=(False, 10), ax=ax)
ax.set_xticks([-1, 0, 1])
# plt.savefig(f'majortype_{group_name}_diffcomp_statscorr.pdf', transparent=True)
[<matplotlib.axis.XTick at 0x7f509c603210>,
 <matplotlib.axis.XTick at 0x7f509c600250>,
 <matplotlib.axis.XTick at 0x7f509c626350>]