Assign DipC cells to RNA clusters#
import time
import numpy as np
import pandas as pd
from glob import glob
import anndata
import scanpy as sc
import scanpy.external as sce
import matplotlib as mpl
import matplotlib.pyplot as plt
from matplotlib.colors import LogNorm
from matplotlib import cm as cm
import seaborn as sns
from scipy.sparse import csr_matrix
from ALLCools.plot import *
from ALLCools.clustering import *
from ALLCools.integration.seurat_class import SeuratIntegration
from sklearn.decomposition import TruncatedSVD
from sklearn.preprocessing import normalize, OneHotEncoder
import pynndescent

mpl.style.use('default')
mpl.rcParams['pdf.fonttype'] = 42
mpl.rcParams['ps.fonttype'] = 42
mpl.rcParams['font.family'] = 'sans-serif'
mpl.rcParams['font.sans-serif'] = 'Helvetica'
gene_hdf = pd.read_hdf(f'/data/test_schicluster/Tan2021/scool/dataset/Tan2021.geneimputescore.hdf', key='data')
res = 10000
gene_meta_path = '/data/ref/mm10/gencode/vm22/gencode.vM22.annotation.gene.flat.tsv.gz'
gene_meta = pd.read_csv(gene_meta_path, index_col='gene_id', sep='\t')
gene_meta['bin_len'] = (gene_meta['end'] // res) - (gene_meta['start'] // res) + 1
#gene_meta['weight'] = gene_meta['bin_len'] * (gene_meta['bin_len'] + 1) / 2
gene_meta['weight'] = (gene_meta['bin_len']+2) * (gene_meta['bin_len'] + 1) / 2
#gene_meta['weight'] = gene_meta['bin_len'].copy()
indir = '/home/jzhou_salk_edu/sky_workdir/test_schicluster/Tan2021/'
chrom_size_path = '/data/ref/mm10/genome/mm10.main.chrom.sizes'
chromsize = pd.read_csv(chrom_size_path, sep='\t', header=None, index_col=0)
gene_meta = gene_meta[gene_meta['chrom'].isin(chromsize.index)]
gene_meta
| chrom | source | feature | start | end | score | strand | phase | transcript_id | gene_type | ... | transcript_status | transcript_name | exon_number | exon_id | level | mgi_id | havana_gene | tag | bin_len | weight | |
|---|---|---|---|---|---|---|---|---|---|---|---|---|---|---|---|---|---|---|---|---|---|
| gene_id | |||||||||||||||||||||
| ENSMUSG00000102693.1 | chr1 | HAVANA | gene | 3073253 | 3074322 | . | + | . | NaN | TEC | ... | NaN | NaN | NaN | NaN | 2 | MGI:1918292 | OTTMUSG00000049935.1 | NaN | 1 | 3.0 |
| ENSMUSG00000064842.1 | chr1 | ENSEMBL | gene | 3102016 | 3102125 | . | + | . | NaN | snRNA | ... | NaN | NaN | NaN | NaN | 3 | MGI:5455983 | NaN | NaN | 1 | 3.0 |
| ENSMUSG00000051951.5 | chr1 | HAVANA | gene | 3205901 | 3671498 | . | - | . | NaN | protein_coding | ... | NaN | NaN | NaN | NaN | 2 | MGI:3528744 | OTTMUSG00000026353.2 | NaN | 48 | 1225.0 |
| ENSMUSG00000102851.1 | chr1 | HAVANA | gene | 3252757 | 3253236 | . | + | . | NaN | processed_pseudogene | ... | NaN | NaN | NaN | NaN | 1 | MGI:5011141 | OTTMUSG00000049958.1 | pseudo_consens | 1 | 3.0 |
| ENSMUSG00000103377.1 | chr1 | HAVANA | gene | 3365731 | 3368549 | . | - | . | NaN | TEC | ... | NaN | NaN | NaN | NaN | 2 | MGI:5610408 | OTTMUSG00000049960.1 | NaN | 1 | 3.0 |
| ... | ... | ... | ... | ... | ... | ... | ... | ... | ... | ... | ... | ... | ... | ... | ... | ... | ... | ... | ... | ... | ... |
| ENSMUSG00000064368.1 | chrM | ENSEMBL | gene | 13552 | 14070 | . | - | . | NaN | protein_coding | ... | NaN | NaN | NaN | NaN | 3 | MGI:102495 | NaN | NaN | 1 | 3.0 |
| ENSMUSG00000064369.1 | chrM | ENSEMBL | gene | 14071 | 14139 | . | - | . | NaN | Mt_tRNA | ... | NaN | NaN | NaN | NaN | 3 | MGI:102488 | NaN | NaN | 1 | 3.0 |
| ENSMUSG00000064370.1 | chrM | ENSEMBL | gene | 14145 | 15288 | . | + | . | NaN | protein_coding | ... | NaN | NaN | NaN | NaN | 3 | MGI:102501 | NaN | NaN | 1 | 3.0 |
| ENSMUSG00000064371.1 | chrM | ENSEMBL | gene | 15289 | 15355 | . | + | . | NaN | Mt_tRNA | ... | NaN | NaN | NaN | NaN | 3 | MGI:102473 | NaN | NaN | 1 | 3.0 |
| ENSMUSG00000064372.1 | chrM | ENSEMBL | gene | 15356 | 15422 | . | - | . | NaN | Mt_tRNA | ... | NaN | NaN | NaN | NaN | 3 | MGI:102478 | NaN | NaN | 1 | 3.0 |
55487 rows × 23 columns
#gene_hdf = gene_hdf * gene_meta.loc[gene_hdf.columns, 'weight']
(gene_hdf>0).sum(axis=1)
cortex-p001-cb_034         39820
cortex-p001-cb_025         44877
cortex-p001-cb_119         48588
cortex-p001-cb_009         49538
cortex-p001-cb_005         49383
                           ...
hippocampus-p347-cb_166    50257
hippocampus-p347-cb_191    49946
hippocampus-p347-cb_178    50059
hippocampus-p347-cb_187    49801
hippocampus-p347-cb_188    50075
Length: 3646, dtype: int64
adata = anndata.read_h5ad(f'{indir}Tan2021_dipc.h5ad')
adata
AnnData object with n_obs × n_vars = 3646 × 1
    obs: 'tissue', 'treatment', 'age', 'sex', 'father', 'mother', 'restriction enzyme', 'cell-type cluster', 'contacts', 'umap_0', 'umap_1', 'leiden'
    uns: 'leiden', 'neighbors', 'umap'
    obsm: 'X_pca', 'X_umap', 'dipc_pca_all'
    obsp: 'connectivities', 'distances'
gene3c = anndata.AnnData(gene_hdf.loc[adata.obs.index], obs=adata.obs, var=gene_meta.loc[gene_hdf.columns])
gene3c
AnnData object with n_obs × n_vars = 3646 × 51259
    obs: 'tissue', 'treatment', 'age', 'sex', 'father', 'mother', 'restriction enzyme', 'cell-type cluster', 'contacts', 'umap_0', 'umap_1', 'leiden'
    var: 'chrom', 'source', 'feature', 'start', 'end', 'score', 'strand', 'phase', 'transcript_id', 'gene_type', 'gene_status', 'gene_name', 'transcript_type', 'transcript_status', 'transcript_name', 'exon_number', 'exon_id', 'level', 'mgi_id', 'havana_gene', 'tag', 'bin_len', 'weight'
chrom_to_remove = ['chrL', 'chrM', 'chrX', 'chrY']
chrfilter = ~gene3c.var['chrom'].isin(chrom_to_remove)
gene3c = gene3c[:, chrfilter]
genefilter = ((gene3c.X>0).sum(axis=0)>10)
gene3c = gene3c[:, genefilter]
gene3c
View of AnnData object with n_obs × n_vars = 3646 × 51097
    obs: 'tissue', 'treatment', 'age', 'sex', 'father', 'mother', 'restriction enzyme', 'cell-type cluster', 'contacts', 'umap_0', 'umap_1', 'leiden'
    var: 'chrom', 'source', 'feature', 'start', 'end', 'score', 'strand', 'phase', 'transcript_id', 'gene_type', 'gene_status', 'gene_name', 'transcript_type', 'transcript_status', 'transcript_name', 'exon_number', 'exon_id', 'level', 'mgi_id', 'havana_gene', 'tag', 'bin_len', 'weight'
gene3c.var.index.name = 'gene_id'
gene3c.raw = gene3c.copy()
#sc.pp.highly_variable_genes(gene3c, n_top_genes=2000, flavor='seurat_v3')
gene3c.write_h5ad(f'cell_{gene3c.shape[0]}_gene3C.h5ad')
# gene3c = anndata.read_h5ad(f'{indir}cell_8225_gene3C_impute.h5ad')
gene3c = anndata.read_h5ad(glob(f'cell_*_gene3C.h5ad')[0])
gene3c
AnnData object with n_obs × n_vars = 3646 × 51097
    obs: 'tissue', 'treatment', 'age', 'sex', 'father', 'mother', 'restriction enzyme', 'cell-type cluster', 'contacts', 'umap_0', 'umap_1', 'leiden'
    var: 'chrom', 'source', 'feature', 'start', 'end', 'score', 'strand', 'phase', 'transcript_id', 'gene_type', 'gene_status', 'gene_name', 'transcript_type', 'transcript_status', 'transcript_name', 'exon_number', 'exon_id', 'level', 'mgi_id', 'havana_gene', 'tag', 'bin_len', 'weight'
gene_meta
| chrom | source | feature | start | end | score | strand | phase | transcript_id | gene_type | ... | transcript_status | transcript_name | exon_number | exon_id | level | mgi_id | havana_gene | tag | bin_len | weight | |
|---|---|---|---|---|---|---|---|---|---|---|---|---|---|---|---|---|---|---|---|---|---|
| gene_id | |||||||||||||||||||||
| ENSMUSG00000102693.1 | chr1 | HAVANA | gene | 3073253 | 3074322 | . | + | . | NaN | TEC | ... | NaN | NaN | NaN | NaN | 2 | MGI:1918292 | OTTMUSG00000049935.1 | NaN | 1 | 3.0 |
| ENSMUSG00000064842.1 | chr1 | ENSEMBL | gene | 3102016 | 3102125 | . | + | . | NaN | snRNA | ... | NaN | NaN | NaN | NaN | 3 | MGI:5455983 | NaN | NaN | 1 | 3.0 |
| ENSMUSG00000051951.5 | chr1 | HAVANA | gene | 3205901 | 3671498 | . | - | . | NaN | protein_coding | ... | NaN | NaN | NaN | NaN | 2 | MGI:3528744 | OTTMUSG00000026353.2 | NaN | 48 | 1225.0 |
| ENSMUSG00000102851.1 | chr1 | HAVANA | gene | 3252757 | 3253236 | . | + | . | NaN | processed_pseudogene | ... | NaN | NaN | NaN | NaN | 1 | MGI:5011141 | OTTMUSG00000049958.1 | pseudo_consens | 1 | 3.0 |
| ENSMUSG00000103377.1 | chr1 | HAVANA | gene | 3365731 | 3368549 | . | - | . | NaN | TEC | ... | NaN | NaN | NaN | NaN | 2 | MGI:5610408 | OTTMUSG00000049960.1 | NaN | 1 | 3.0 |
| ... | ... | ... | ... | ... | ... | ... | ... | ... | ... | ... | ... | ... | ... | ... | ... | ... | ... | ... | ... | ... | ... |
| ENSMUSG00000064368.1 | chrM | ENSEMBL | gene | 13552 | 14070 | . | - | . | NaN | protein_coding | ... | NaN | NaN | NaN | NaN | 3 | MGI:102495 | NaN | NaN | 1 | 3.0 |
| ENSMUSG00000064369.1 | chrM | ENSEMBL | gene | 14071 | 14139 | . | - | . | NaN | Mt_tRNA | ... | NaN | NaN | NaN | NaN | 3 | MGI:102488 | NaN | NaN | 1 | 3.0 |
| ENSMUSG00000064370.1 | chrM | ENSEMBL | gene | 14145 | 15288 | . | + | . | NaN | protein_coding | ... | NaN | NaN | NaN | NaN | 3 | MGI:102501 | NaN | NaN | 1 | 3.0 |
| ENSMUSG00000064371.1 | chrM | ENSEMBL | gene | 15289 | 15355 | . | + | . | NaN | Mt_tRNA | ... | NaN | NaN | NaN | NaN | 3 | MGI:102473 | NaN | NaN | 1 | 3.0 |
| ENSMUSG00000064372.1 | chrM | ENSEMBL | gene | 15356 | 15422 | . | - | . | NaN | Mt_tRNA | ... | NaN | NaN | NaN | NaN | 3 | MGI:102478 | NaN | NaN | 1 | 3.0 |
55487 rows × 23 columns
gene3c.var.index = gene_meta.loc[gene3c.var.index, 'gene_name']
gene3c.var_names_make_unique()
sc.pp.normalize_total(gene3c, target_sum=np.median(gene3c.X.sum(axis=1)))
expr = anndata.read_h5ad(f'{indir}Tan2021_rna.h5ad')
expr
AnnData object with n_obs × n_vars = 3517 × 3000
    obs: 'Genes', 'nUMI', 'umap_0', 'umap_1', 'age', 'region', 'cluster'
    var: 'chrom', 'start', 'end', 'gene_id', 'strand', 'n_cells', 'highly_variable', 'highly_variable_rank', 'means', 'variances', 'variances_norm'
    uns: 'hvg', 'log1p', 'neighbors', 'umap'
    obsm: 'X_pca', 'X_umap', 'rna_pca_all'
    obsp: 'connectivities', 'distances'
expr = anndata.AnnData(X=expr.raw.X, obs=expr.obs, var=expr.raw.var, raw=expr.raw, obsm=expr.obsm, uns=expr.uns, obsp=expr.obsp)
expr = expr[:, expr.var.index.isin(gene3c.var.index)]
expr
View of AnnData object with n_obs × n_vars = 3517 × 24511
    obs: 'Genes', 'nUMI', 'umap_0', 'umap_1', 'age', 'region', 'cluster'
    var: 'chrom', 'start', 'end', 'gene_id', 'strand', 'n_cells', 'highly_variable', 'highly_variable_rank', 'means', 'variances', 'variances_norm'
    uns: 'hvg', 'log1p', 'neighbors', 'umap'
    obsm: 'X_pca', 'X_umap', 'rna_pca_all'
    obsp: 'connectivities', 'distances'
gene3c = gene3c[:, gene3c.var.index.isin(expr.var.index)]
gene3c
View of AnnData object with n_obs × n_vars = 3646 × 24511
    obs: 'tissue', 'treatment', 'age', 'sex', 'father', 'mother', 'restriction enzyme', 'cell-type cluster', 'contacts', 'umap_0', 'umap_1', 'leiden'
    var: 'chrom', 'source', 'feature', 'start', 'end', 'score', 'strand', 'phase', 'transcript_id', 'gene_type', 'gene_status', 'gene_name', 'transcript_type', 'transcript_status', 'transcript_name', 'exon_number', 'exon_id', 'level', 'mgi_id', 'havana_gene', 'tag', 'bin_len', 'weight'
tmp = np.std(gene3c.X, axis=0)
from scipy.stats import rankdata
tmp = rankdata(-tmp)
gene3c.var['highly_variable'] = (tmp<2000)
gene3c = gene3c[:, gene3c.var['highly_variable']]
expr = expr[:, gene3c.var.index]
# sc.pp.highly_variable_genes(expr, n_top_genes=2000)
# expr = expr[:, expr.var.highly_variable]
sc.pp.regress_out(expr, ['nUMI'])
sc.pp.scale(expr, max_value=10)
dim = 50
model = TruncatedSVD(n_components=dim, algorithm='arpack')
matrix_reduce = model.fit_transform(expr.X)
matrix_reduce = matrix_reduce / model.singular_values_
expr.obsm['rna_pca_all'] = matrix_reduce.copy()
significant_pc_test(expr, p_cutoff=0.1, update=False, obsm='rna_pca_all')
15 components passed P cutoff of 0.1.
15
def dump_embedding(adata, name, n_dim=2):
    # put manifold coordinates into adata.obs
    for i in range(n_dim):
        adata.obs[f'{name}_{i}'] = adata.obsm[f'X_{name}'][:, i]
    return adata
knn = 25
expr.obsm['X_pca'] = normalize(expr.obsm['rna_pca_all'][:, :30], axis=1)
sc.pp.neighbors(expr, n_neighbors=knn, use_rep='X_pca')
sc.tl.umap(expr, maxiter=200, random_state=0)
expr = dump_embedding(expr, 'umap')
expr.obsm['rna_u30_umap'] = expr.obsm['X_umap'].copy()
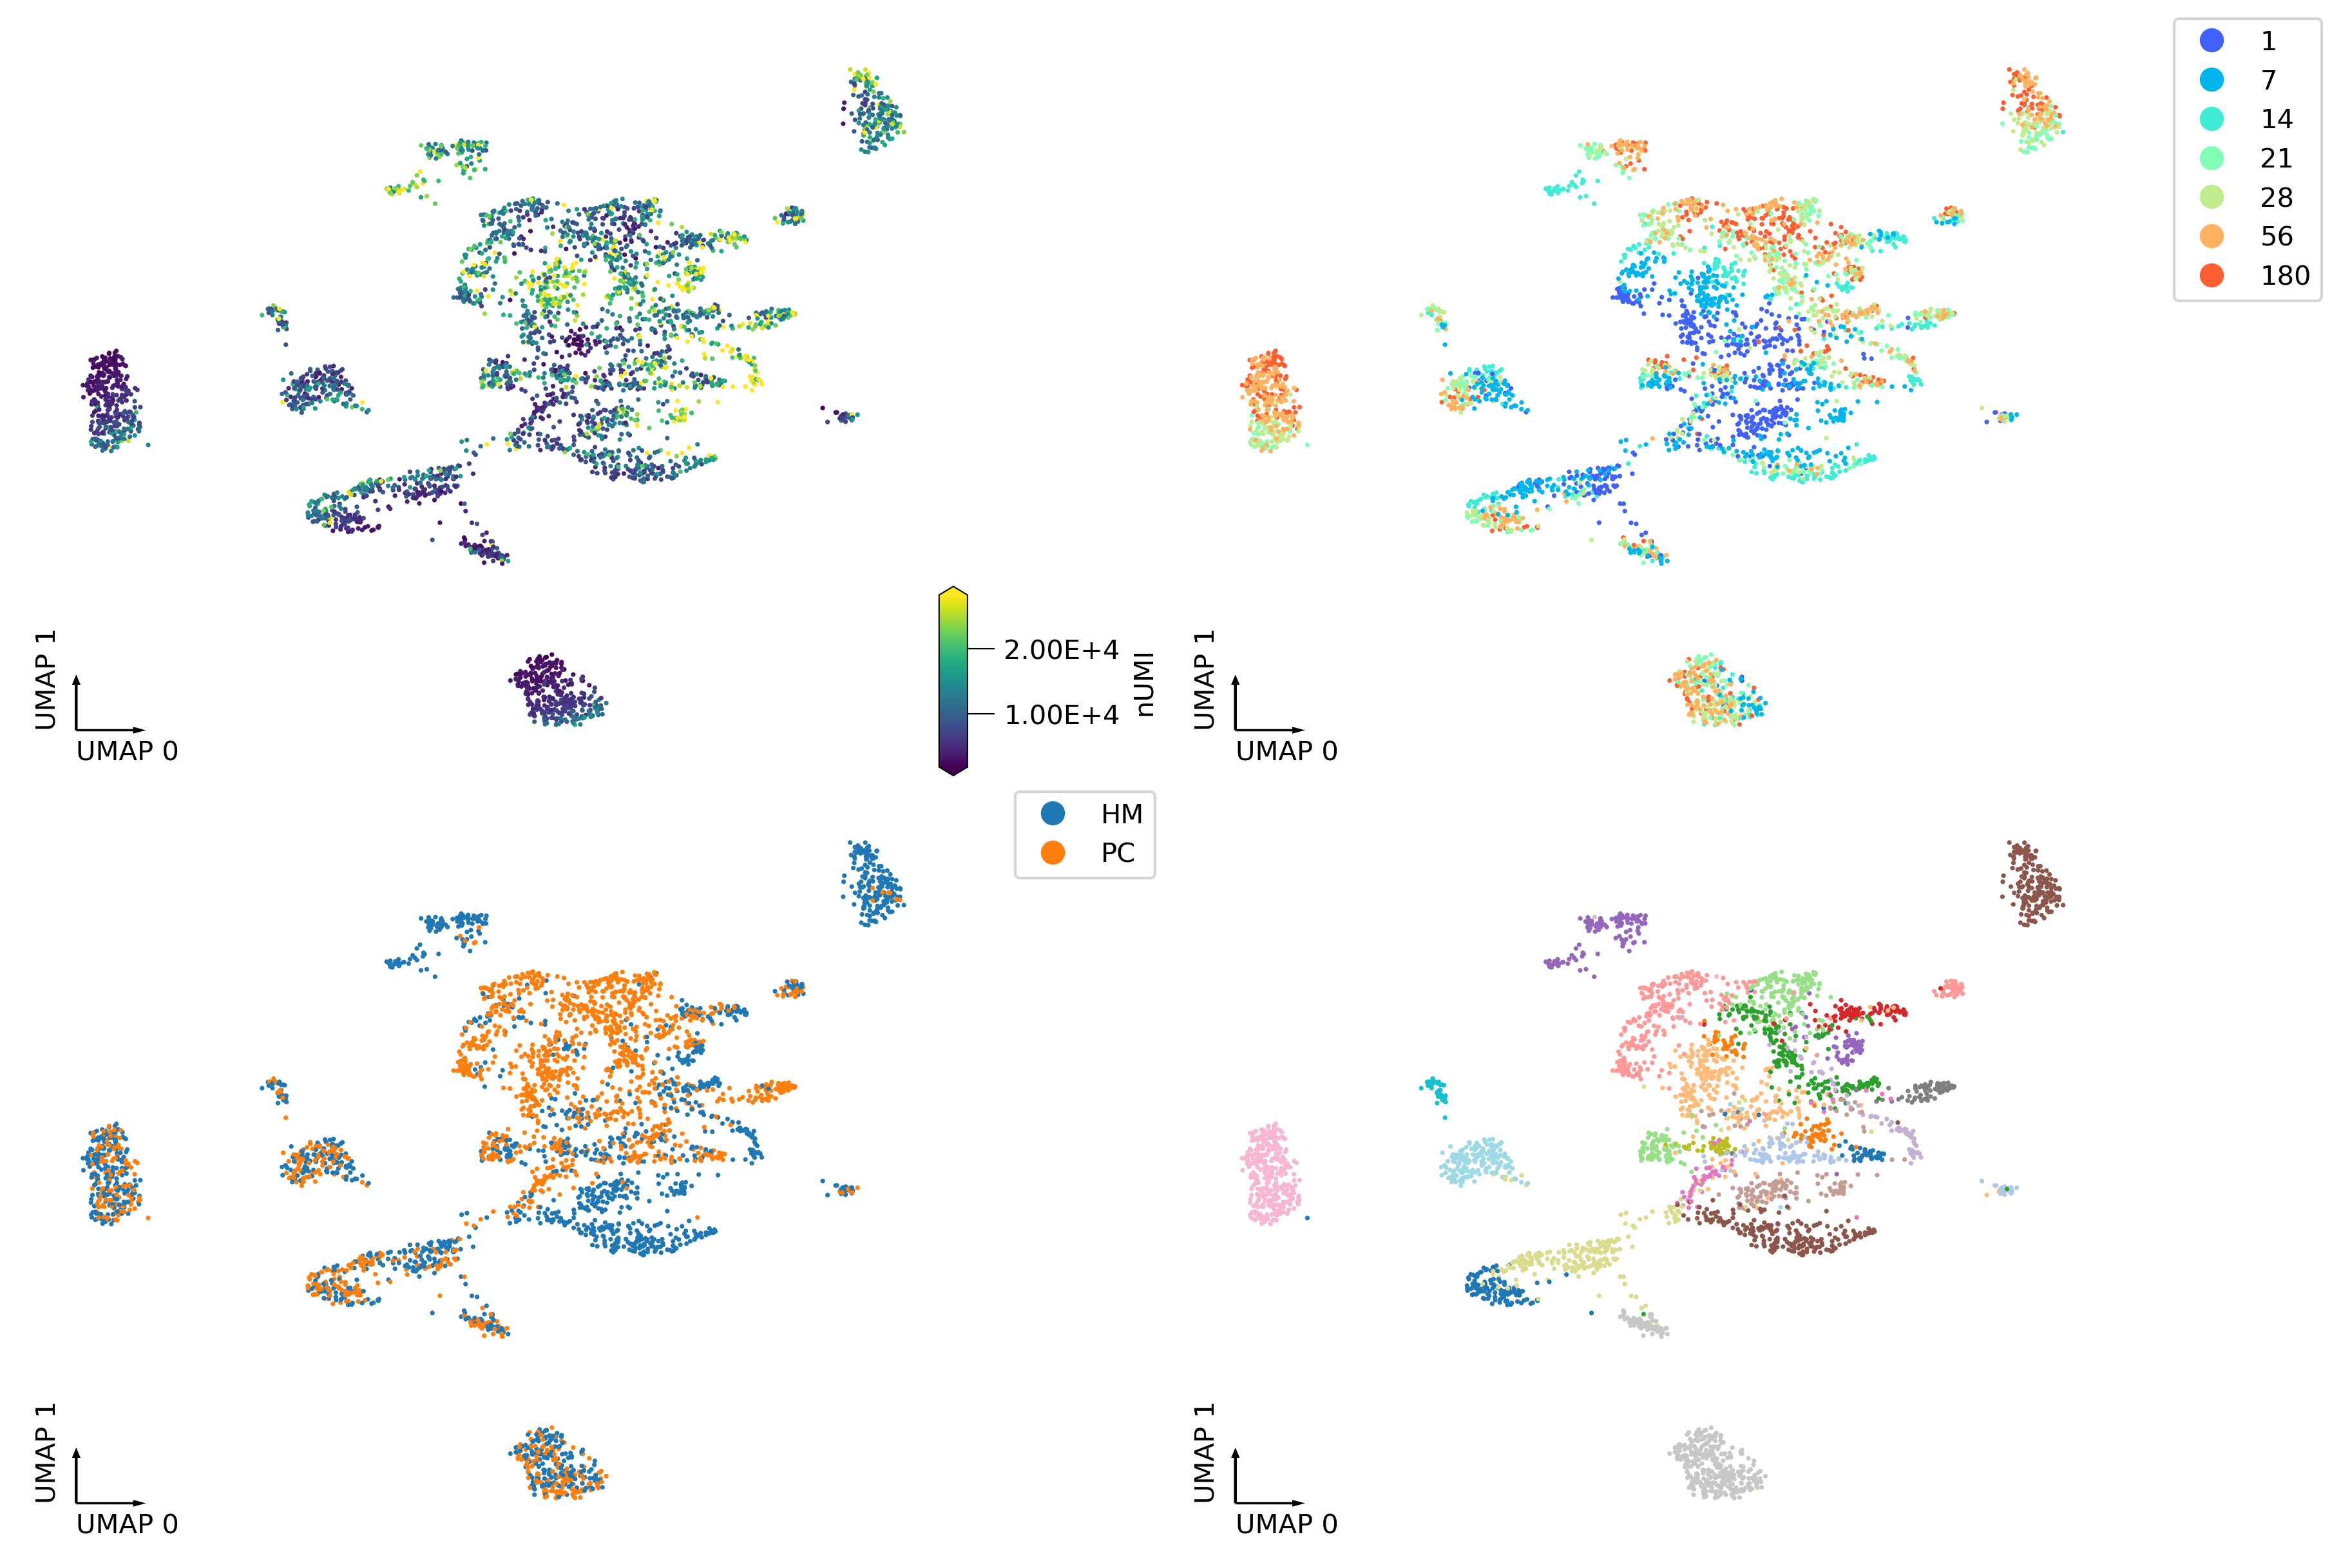
fig, axes = plt.subplots(2, 2, figsize=(12, 8), dpi=300, constrained_layout=True)
_ = continuous_scatter(ax=axes[0,0],
                       data=expr.obs,
                       hue='nUMI',
                       coord_base='umap',
                       max_points=None,
                       labelsize=10,
                       )
_ = categorical_scatter(data=expr.obs,
                        ax=axes[0,1],
                        coord_base='umap',
                        hue='age',
                        palette='rainbow',
                        labelsize=10,
                        show_legend=True)
_ = categorical_scatter(ax=axes[1,0],
                        data=expr.obs,
                        hue='region',
                        coord_base='umap',
                        # text_anno='region',
                        # palette='tab10',
                        labelsize=10,
                        show_legend=True
                       )
_ = categorical_scatter(ax=axes[1,1],
                        data=expr.obs,
                        hue='cluster',
                        coord_base='umap',
                        # text_anno='cluster',
                        palette='tab20',
                        labelsize=10,
                        # show_legend=True
                       )
findfont: Font family ['sans-serif'] not found. Falling back to DejaVu Sans.
findfont: Generic family 'sans-serif' not found because none of the following families were found: Helvetica
gene3c
View of AnnData object with n_obs × n_vars = 3646 × 1999
    obs: 'tissue', 'treatment', 'age', 'sex', 'father', 'mother', 'restriction enzyme', 'cell-type cluster', 'contacts', 'umap_0', 'umap_1', 'leiden'
    var: 'chrom', 'source', 'feature', 'start', 'end', 'score', 'strand', 'phase', 'transcript_id', 'gene_type', 'gene_status', 'gene_name', 'transcript_type', 'transcript_status', 'transcript_name', 'exon_number', 'exon_id', 'level', 'mgi_id', 'havana_gene', 'tag', 'bin_len', 'weight', 'highly_variable'
sc.pp.regress_out(gene3c, ['contacts'])
sc.pp.scale(gene3c, max_value=10)
gene3c.obsm['X_pca'] = model.transform(gene3c.X) / model.singular_values_
gene3c.obsm['X_pca'] = normalize(gene3c.obsm['X_pca'][:, :30], axis=1)
expr.obs['Modality'] = 'RNA'
gene3c.obs['Modality'] = '3C'
adata_list = [expr, gene3c]
integrator = SeuratIntegration()
anchor = integrator.find_anchor(adata_list,
                                k_local=None,
                                key_local='X_pca',
                                k_anchor=5,
                                key_anchor='X',
                                dim_red='cca',
                                max_cc_cells=50000,
                                k_score=30,
                                k_filter=None,
                                scale1=False,
                                scale2=False,
                                #scale =[False, True]
                                n_components=30,
                                n_features=200,
                                alignments=[[[0], [1]]])
Find anchors across datasets.
Run CCA
non zero dims 30
Find Anchors using k=30
Score Anchors
Identified 6894 anchors between datasets 0 and 1.
start_time = time.time()
corrected = integrator.integrate(key_correct='X_pca',
                                 row_normalize=True,
                                 n_components=30,
                                 k_weight=100,
                                 sd=1,
                                 alignments=[[[0], [1]]])

print(time.time() - start_time)
Merge datasets
[[0], [1]]
Initialize
Find nearest anchors. k_weight:  100
Normalize graph
Transform data
6.461906433105469
ncell = np.sum([xx.shape[0] for xx in adata_list])
adata_merge = anndata.AnnData(
    X=np.ones((ncell, 1)), obs=pd.concat([xx.obs for xx in adata_list], axis=0)
)
adata_merge
AnnData object with n_obs × n_vars = 7163 × 1
    obs: 'Genes', 'nUMI', 'umap_0', 'umap_1', 'age', 'region', 'cluster', 'Modality', 'tissue', 'treatment', 'sex', 'father', 'mother', 'restriction enzyme', 'cell-type cluster', 'contacts', 'leiden'
adata_merge.obsm['u30_seuratcc30nofilter'] = np.concatenate(corrected, axis=0)
adata_merge.obsm['X_pca'] = normalize(adata_merge.obsm['u30_seuratcc30nofilter'][:, :30], axis=1)
# sce.pp.harmony_integrate(adata_merge, 'Modality', max_iter_harmony=30, random_state=0)
# adata_merge.obsm['log_reghvg_cca_u25hm'] = adata_merge.obsm['X_pca_harmony'].copy()
knn = 25
sc.pp.neighbors(adata_merge, n_neighbors=knn, use_rep='u30_seuratcc30nofilter')
sc.tl.umap(adata_merge, maxiter=200, random_state=0)
adata_merge = dump_embedding(adata_merge, 'umap')
adata_merge.obsm['u30_seuratcc30nofilter_u30_umap'] = adata_merge.obsm['X_umap'].copy()
legage = np.sort(adata_merge.obs['age'].unique())
palage = {xx:yy for xx,yy in zip(legage, sns.color_palette('hls', len(legage)))}
# adata_merge.obsm['X_umap'] = adata_merge.obsm['u50_seuratcc30nofilter_u30_umap'].copy()
# dump_embedding(adata_merge, 'umap')
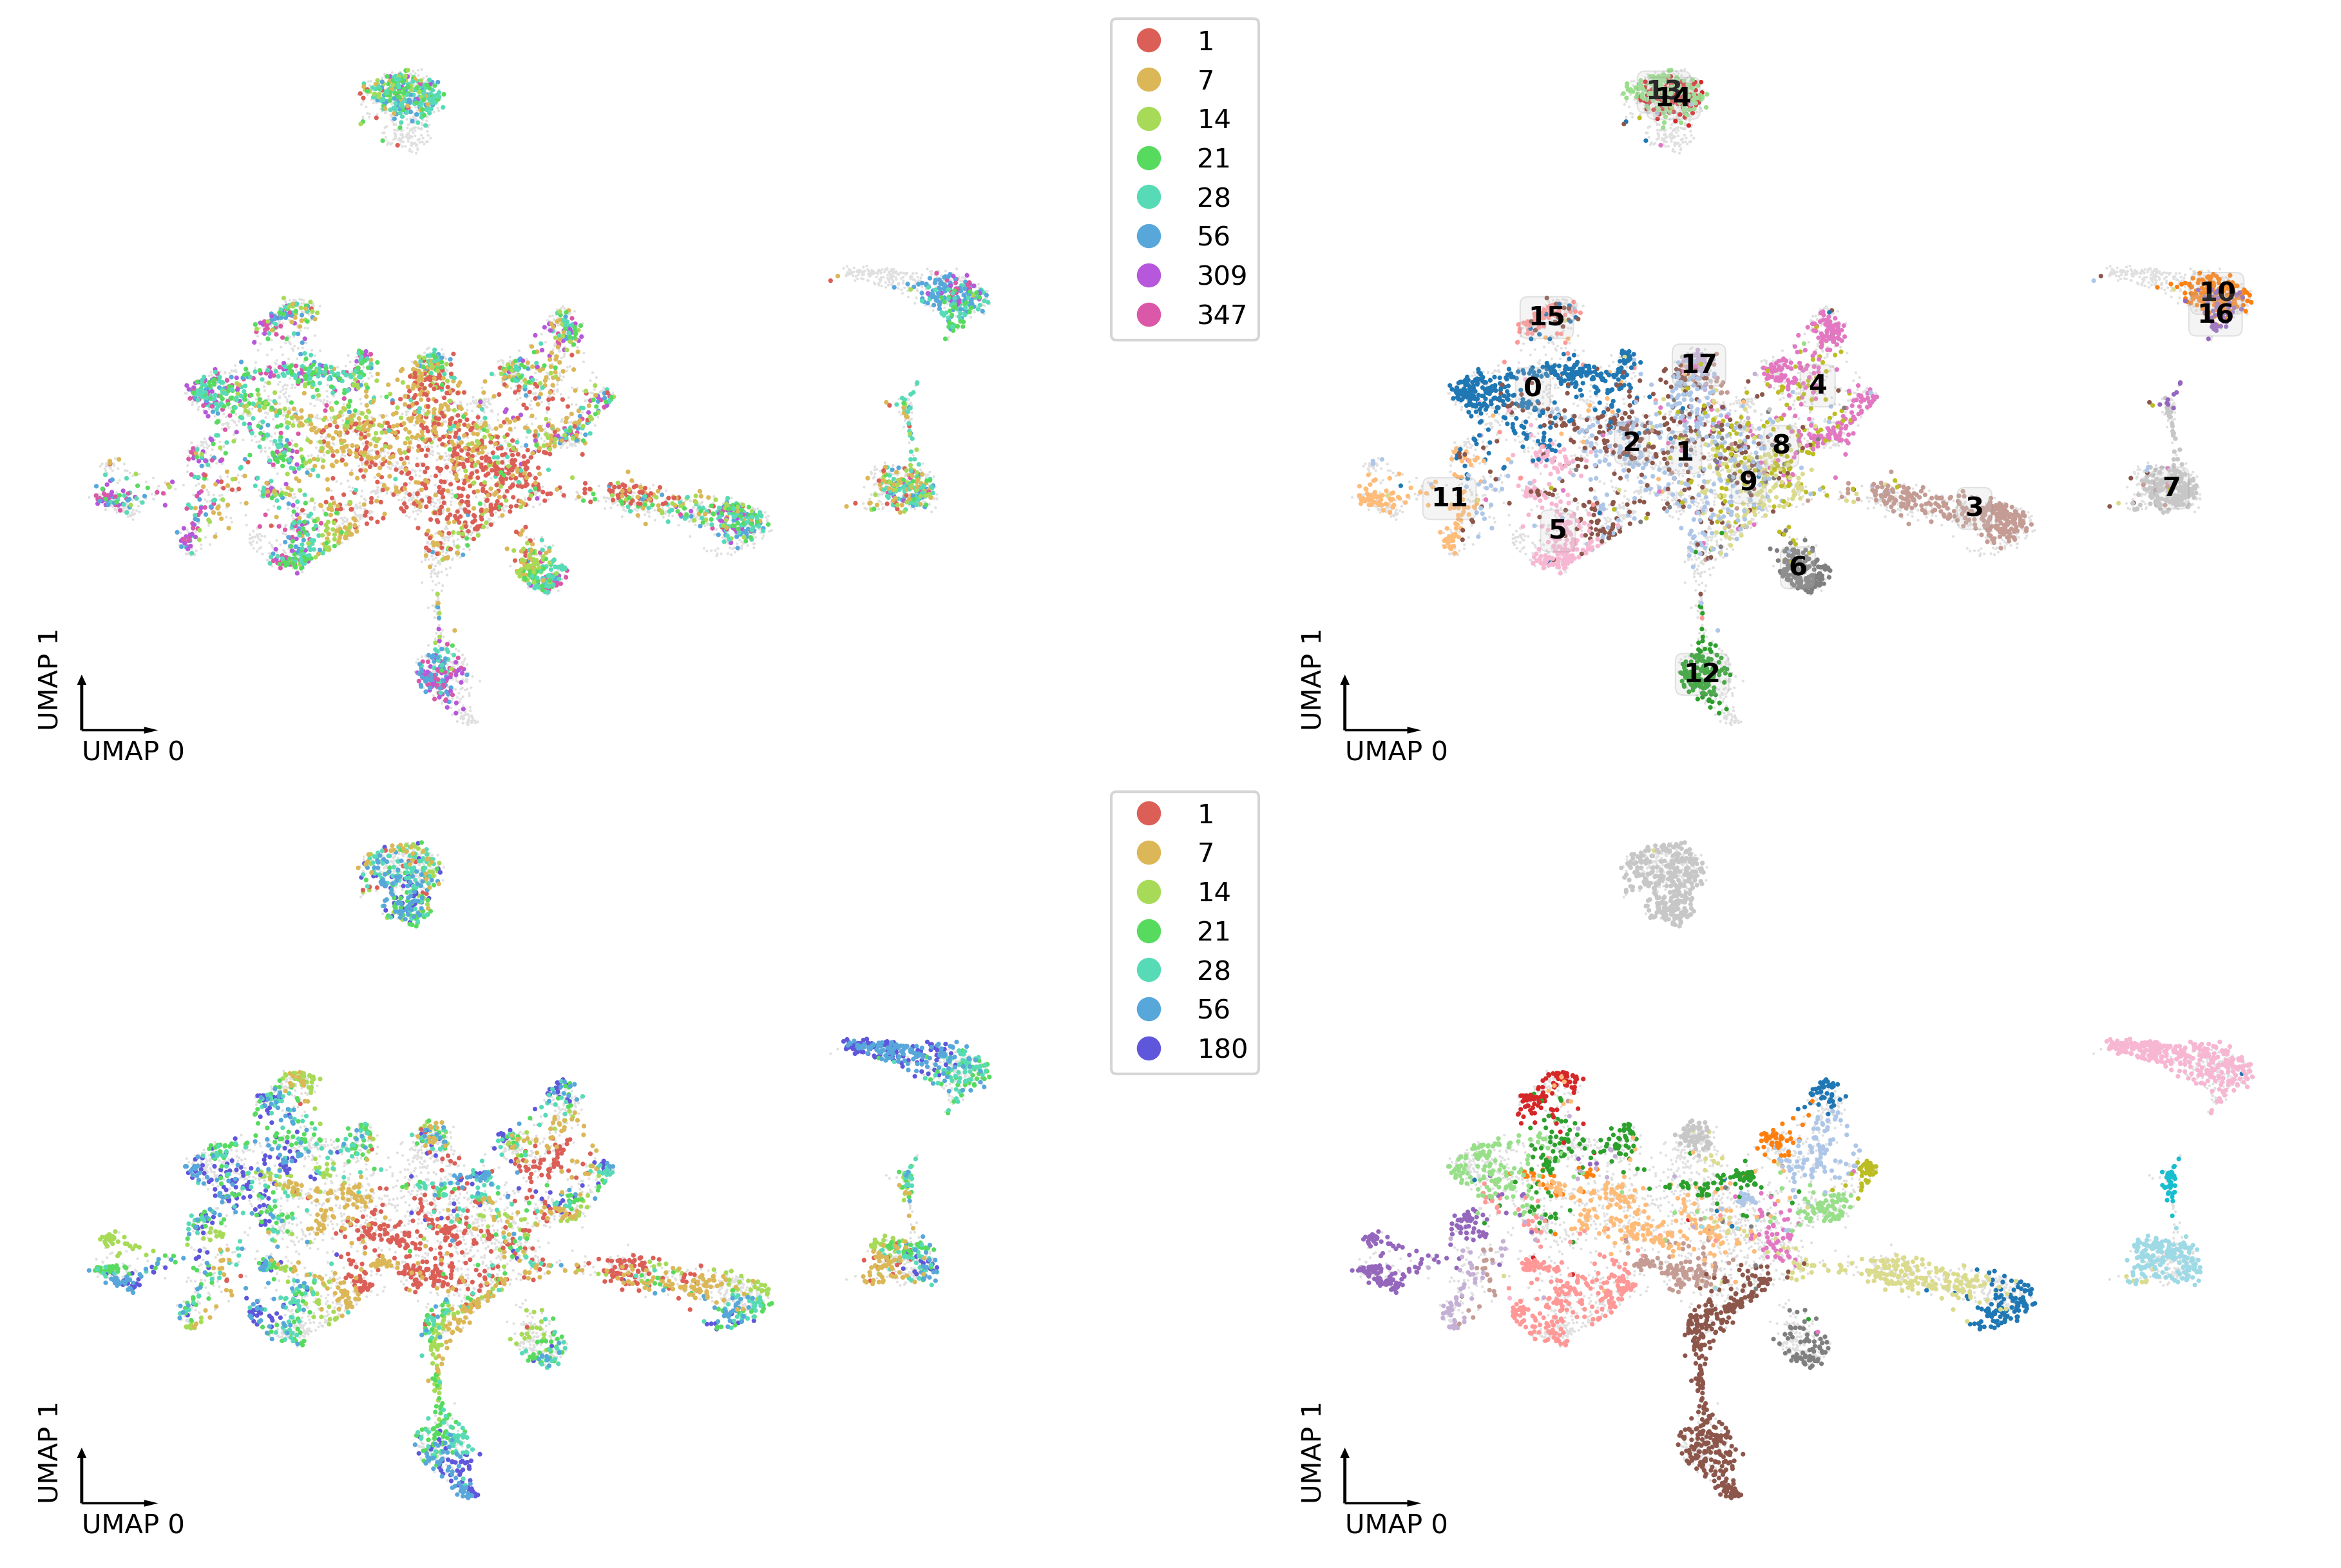
fig, axes = plt.subplots(2, 2, figsize=(12, 8), dpi=300, constrained_layout=True)
tmp = adata_merge.obs.loc[adata_merge.obs['Modality']=='3C']
ax = axes[0,0]
ax.scatter(adata_merge.obs['umap_0'], adata_merge.obs['umap_1'], c='#e0e0e0', edgecolors='none', s=1, rasterized=True)
_ = categorical_scatter(data=tmp,
ax=ax,
coord_base='umap',
hue='age',
palette=palage,
labelsize=10,
show_legend=True)
ax = axes[0,1]
ax.scatter(adata_merge.obs['umap_0'], adata_merge.obs['umap_1'], c='#e0e0e0', edgecolors='none', s=1, rasterized=True)
_ = categorical_scatter(data=tmp,
ax=ax,
coord_base='umap',
hue='leiden',
text_anno='leiden',
palette='tab20',
labelsize=10,
#show_legend=True
)
tmp = adata_merge.obs.loc[adata_merge.obs['Modality']=='RNA']
ax = axes[1,0]
ax.scatter(adata_merge.obs['umap_0'], adata_merge.obs['umap_1'], c='#e0e0e0', edgecolors='none', s=1, rasterized=True)
_ = categorical_scatter(data=tmp,
ax=ax,
coord_base='umap',
hue='age',
palette=palage,
labelsize=10,
show_legend=True)
ax = axes[1,1]
ax.scatter(adata_merge.obs['umap_0'], adata_merge.obs['umap_1'], c='#e0e0e0', edgecolors='none', s=1, rasterized=True)
_ = categorical_scatter(data=tmp,
ax=ax,
coord_base='umap',
hue='cluster',
# text_anno='cluster',
palette='tab20',
labelsize=10,
#show_legend=True
)
findfont: Font family ['sans-serif'] not found. Falling back to DejaVu Sans.
findfont: Generic family 'sans-serif' not found because none of the following families were found: Helvetica
adata_merge.obs.loc[:,adata_merge.obs.dtypes == 'object'] = adata_merge.obs.loc[:,adata_merge.obs.dtypes == 'object'].astype(str)
adata_merge.write_h5ad('Tan2021_rna3c.h5ad')
rna_cell = (adata_merge.obs['Modality']=='RNA')
hic_cell = (adata_merge.obs['Modality']=='3C')
print(rna_cell.sum(), hic_cell.sum())

start_time = time.time()
index = pynndescent.NNDescent(adata_merge.obsm['X_pca'][rna_cell], metric='euclidean', n_neighbors=50, random_state=0, n_jobs=-1)
print(time.time() - start_time)
G, D = index.query(adata_merge.obsm['X_pca'][hic_cell], k=15)
print(time.time() - start_time)
3517 3646
0.7463104724884033
2.10052227973938
chunk_size = 50000
sd = 1
start_time = time.time()
cellfilter = D[:, -1] == 0
D = 1 - D / D[:, -1][:, None]
D[cellfilter] = 1
D = 1 - np.exp(-D * (sd**2) / 4)
D = D / (np.sum(D, axis=1) + 1e-6)[:, None]
print(time.time() - start_time)
0.0013263225555419922
rna_cell = rna_cell.index[rna_cell]
hic_cell = hic_cell.index[hic_cell]
enc = OneHotEncoder()
# enc.fit(adata_merge.obs.loc[aibs_cell, ['L3']].values.astype(str))
labelref = enc.fit_transform(adata_merge.obs.loc[rna_cell, 'cluster'].astype(str)[:, None])
cluster = pd.DataFrame(index=hic_cell, columns=['rnatype', 'score'], dtype=str)
for chunk_start in range(0, len(hic_cell), chunk_size):
    result = (
        D[chunk_start : (chunk_start + chunk_size), :, None]
        * labelref[G[chunk_start : (chunk_start + chunk_size)].flatten()]
        .toarray()
        .reshape((-1, 15, enc.categories_[0].shape[0]))
    ).sum(axis=1)
    result = pd.DataFrame(
        result,
        columns=enc.categories_[0],
        index=hic_cell[chunk_start : (chunk_start + chunk_size)],
    )
    result = result.loc[:, result.columns != "nan"]
    cluster.loc[result.index, "rnatype"] = result.idxmax(axis=1).values
    cluster.loc[result.index, "score"] = result.max(axis=1).values
    print(chunk_start)

print(time.time() - start_time)
cluster.to_hdf("DipC_rnacluster.hdf", key="data")
0
0.6793961524963379
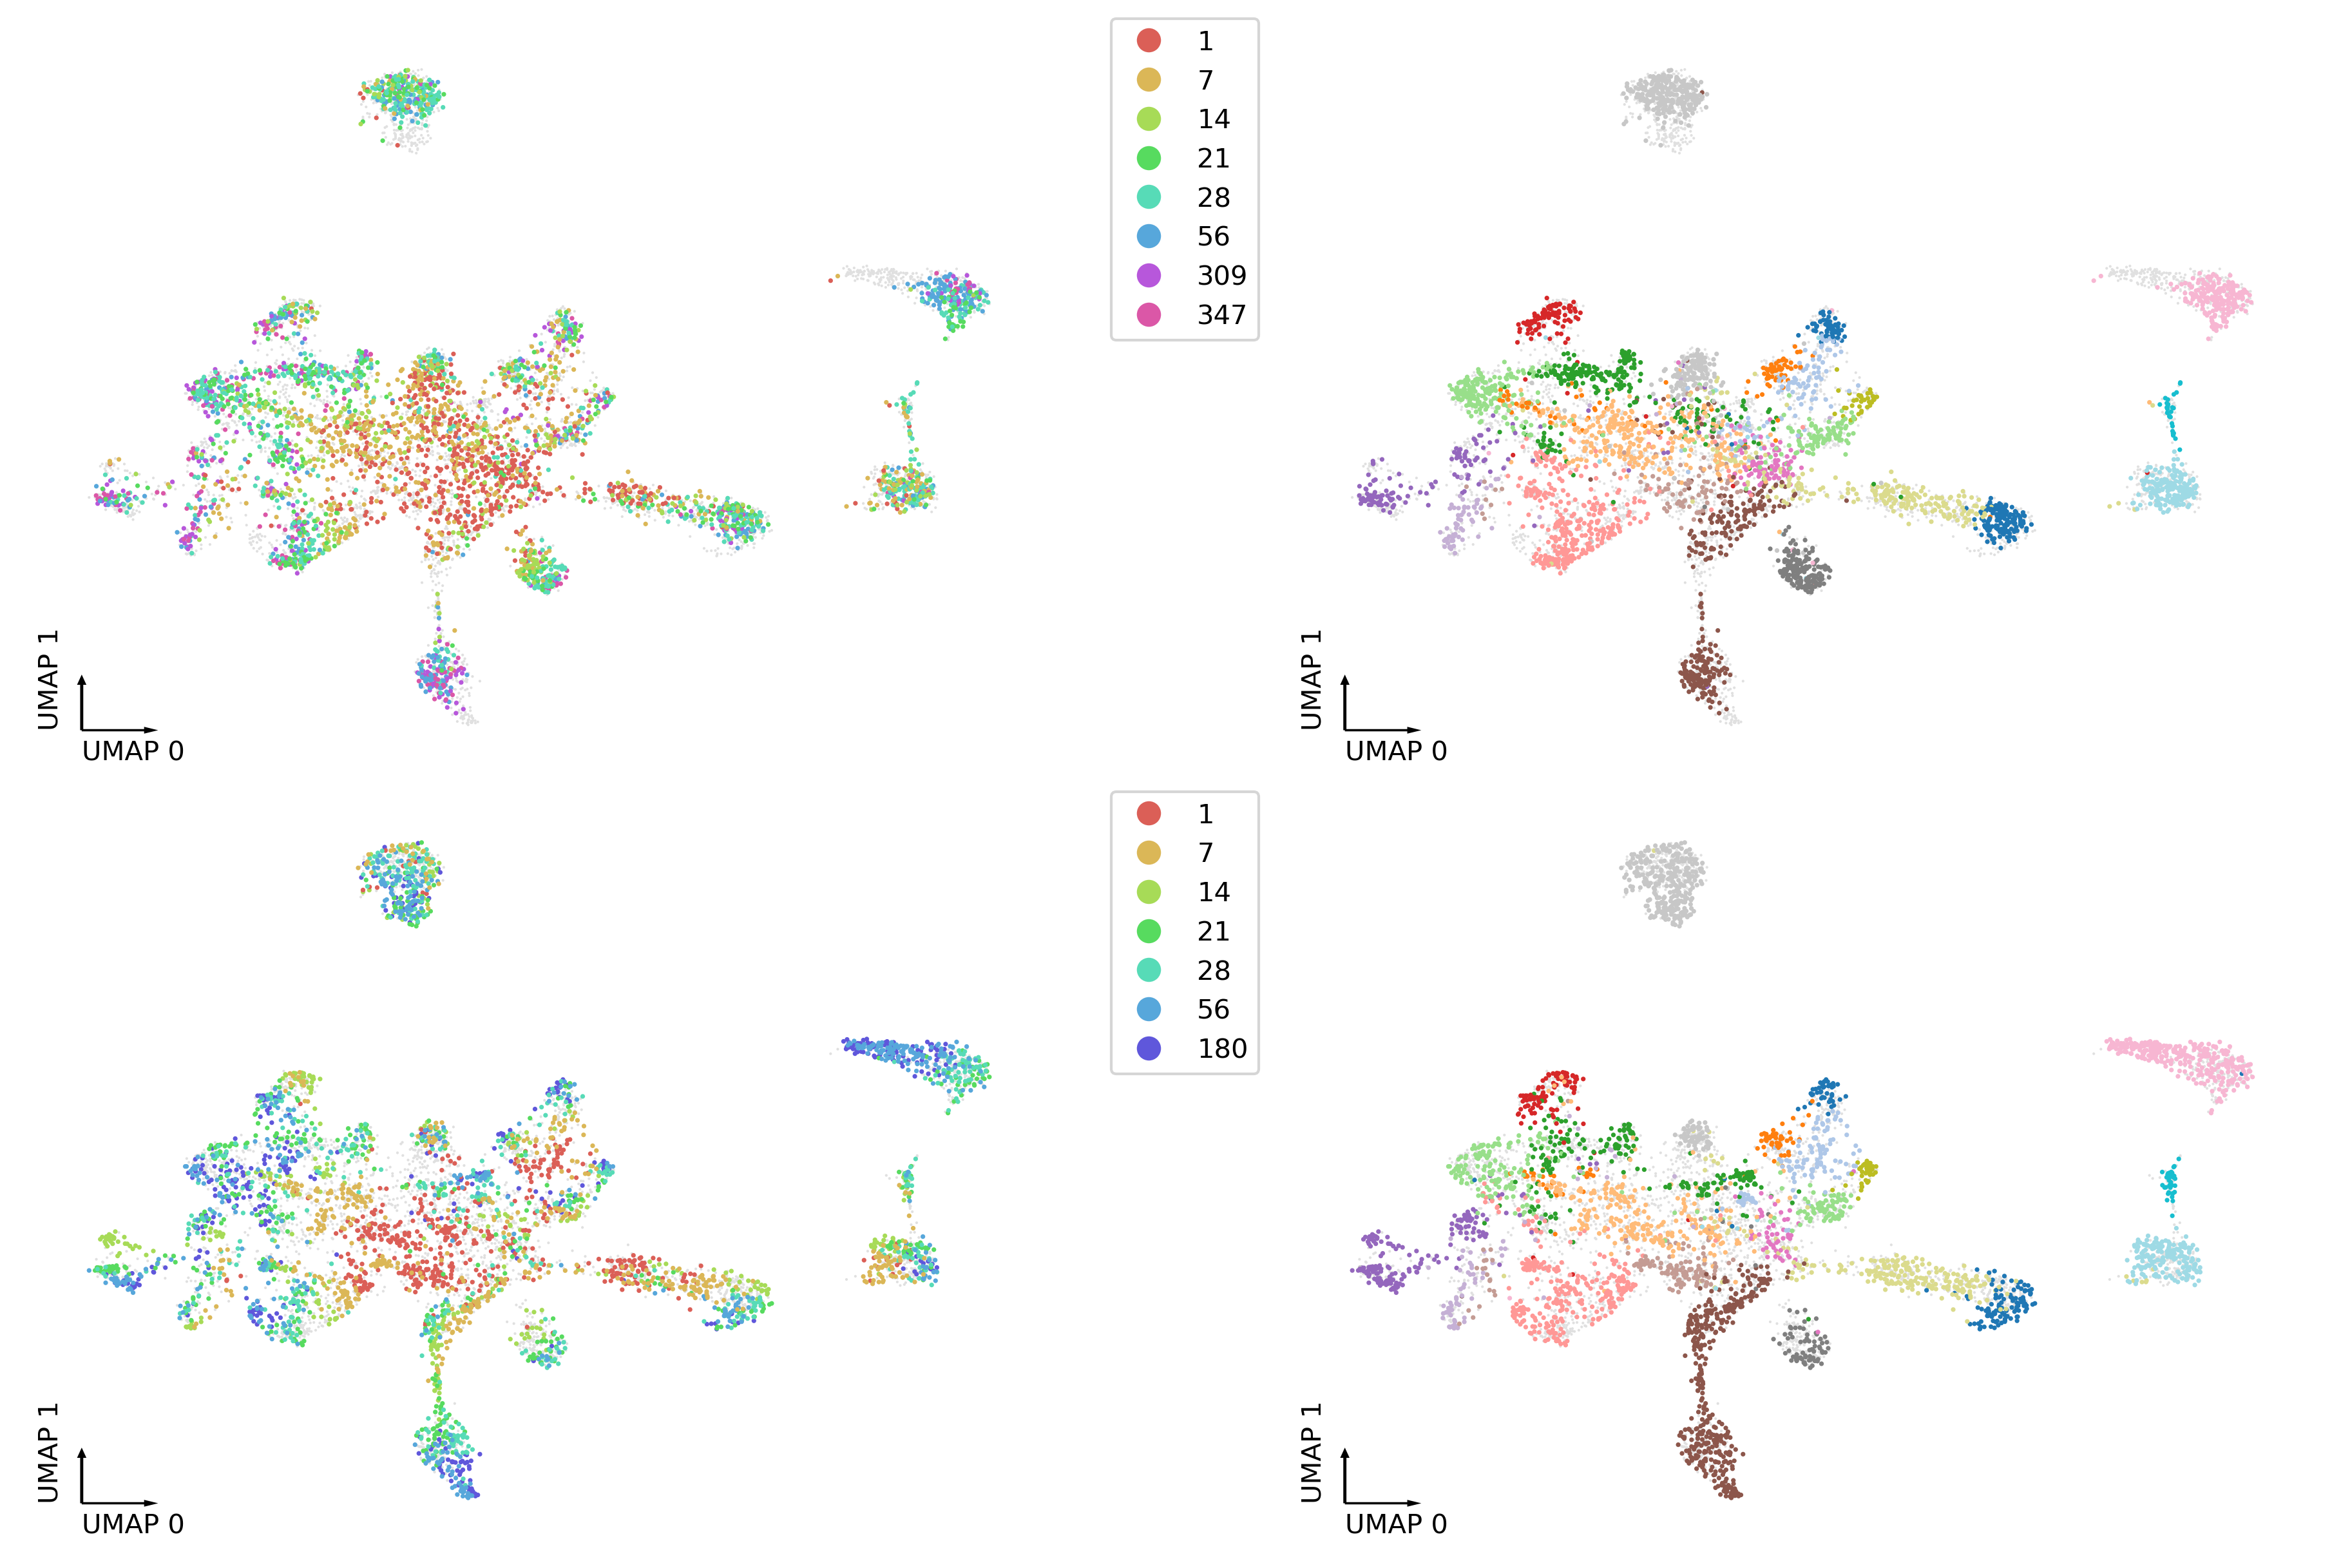
cluster['dipctype'] = adata_merge.obs.loc[hic_cell, 'cell-type cluster']
adata_merge.obs.loc[hic_cell, 'cluster'] = cluster['rnatype']
# adata_merge.obsm['X_umap'] = adata_merge.obsm['u50_seuratcc30nofilter_u30_umap'].copy()
# dump_embedding(adata_merge, 'umap')

fig, axes = plt.subplots(2, 2, figsize=(12, 8), dpi=300, constrained_layout=True)
tmp = adata_merge.obs.loc[adata_merge.obs['Modality']=='3C']
ax = axes[0,0]
ax.scatter(adata_merge.obs['umap_0'], adata_merge.obs['umap_1'], c='#e0e0e0', edgecolors='none', s=1, rasterized=True)
_ = categorical_scatter(data=tmp,
                        ax=ax,
                        coord_base='umap',
                        hue='age',
                        palette=palage,
                        labelsize=10,
                        show_legend=True)

ax = axes[0,1]
ax.scatter(adata_merge.obs['umap_0'], adata_merge.obs['umap_1'], c='#e0e0e0', edgecolors='none', s=1, rasterized=True)
_ = categorical_scatter(data=tmp,
                        ax=ax,
                        coord_base='umap',
                        hue='cluster',
                        # text_anno='celltype',
                        palette='tab20',
                        labelsize=10,
                        #show_legend=True
                       )

tmp = adata_merge.obs.loc[adata_merge.obs['Modality']=='RNA']
ax = axes[1,0]
ax.scatter(adata_merge.obs['umap_0'], adata_merge.obs['umap_1'], c='#e0e0e0', edgecolors='none', s=1, rasterized=True)
_ = categorical_scatter(data=tmp,
                        ax=ax,
                        coord_base='umap',
                        hue='age',
                        palette=palage,
                        labelsize=10,
                        show_legend=True)

ax = axes[1,1]
ax.scatter(adata_merge.obs['umap_0'], adata_merge.obs['umap_1'], c='#e0e0e0', edgecolors='none', s=1, rasterized=True)
_ = categorical_scatter(data=tmp,
                        ax=ax,
                        coord_base='umap',
                        hue='cluster',
                        # text_anno='cluster',
                        palette='tab20',
                        labelsize=10,
                        #show_legend=True
                       )
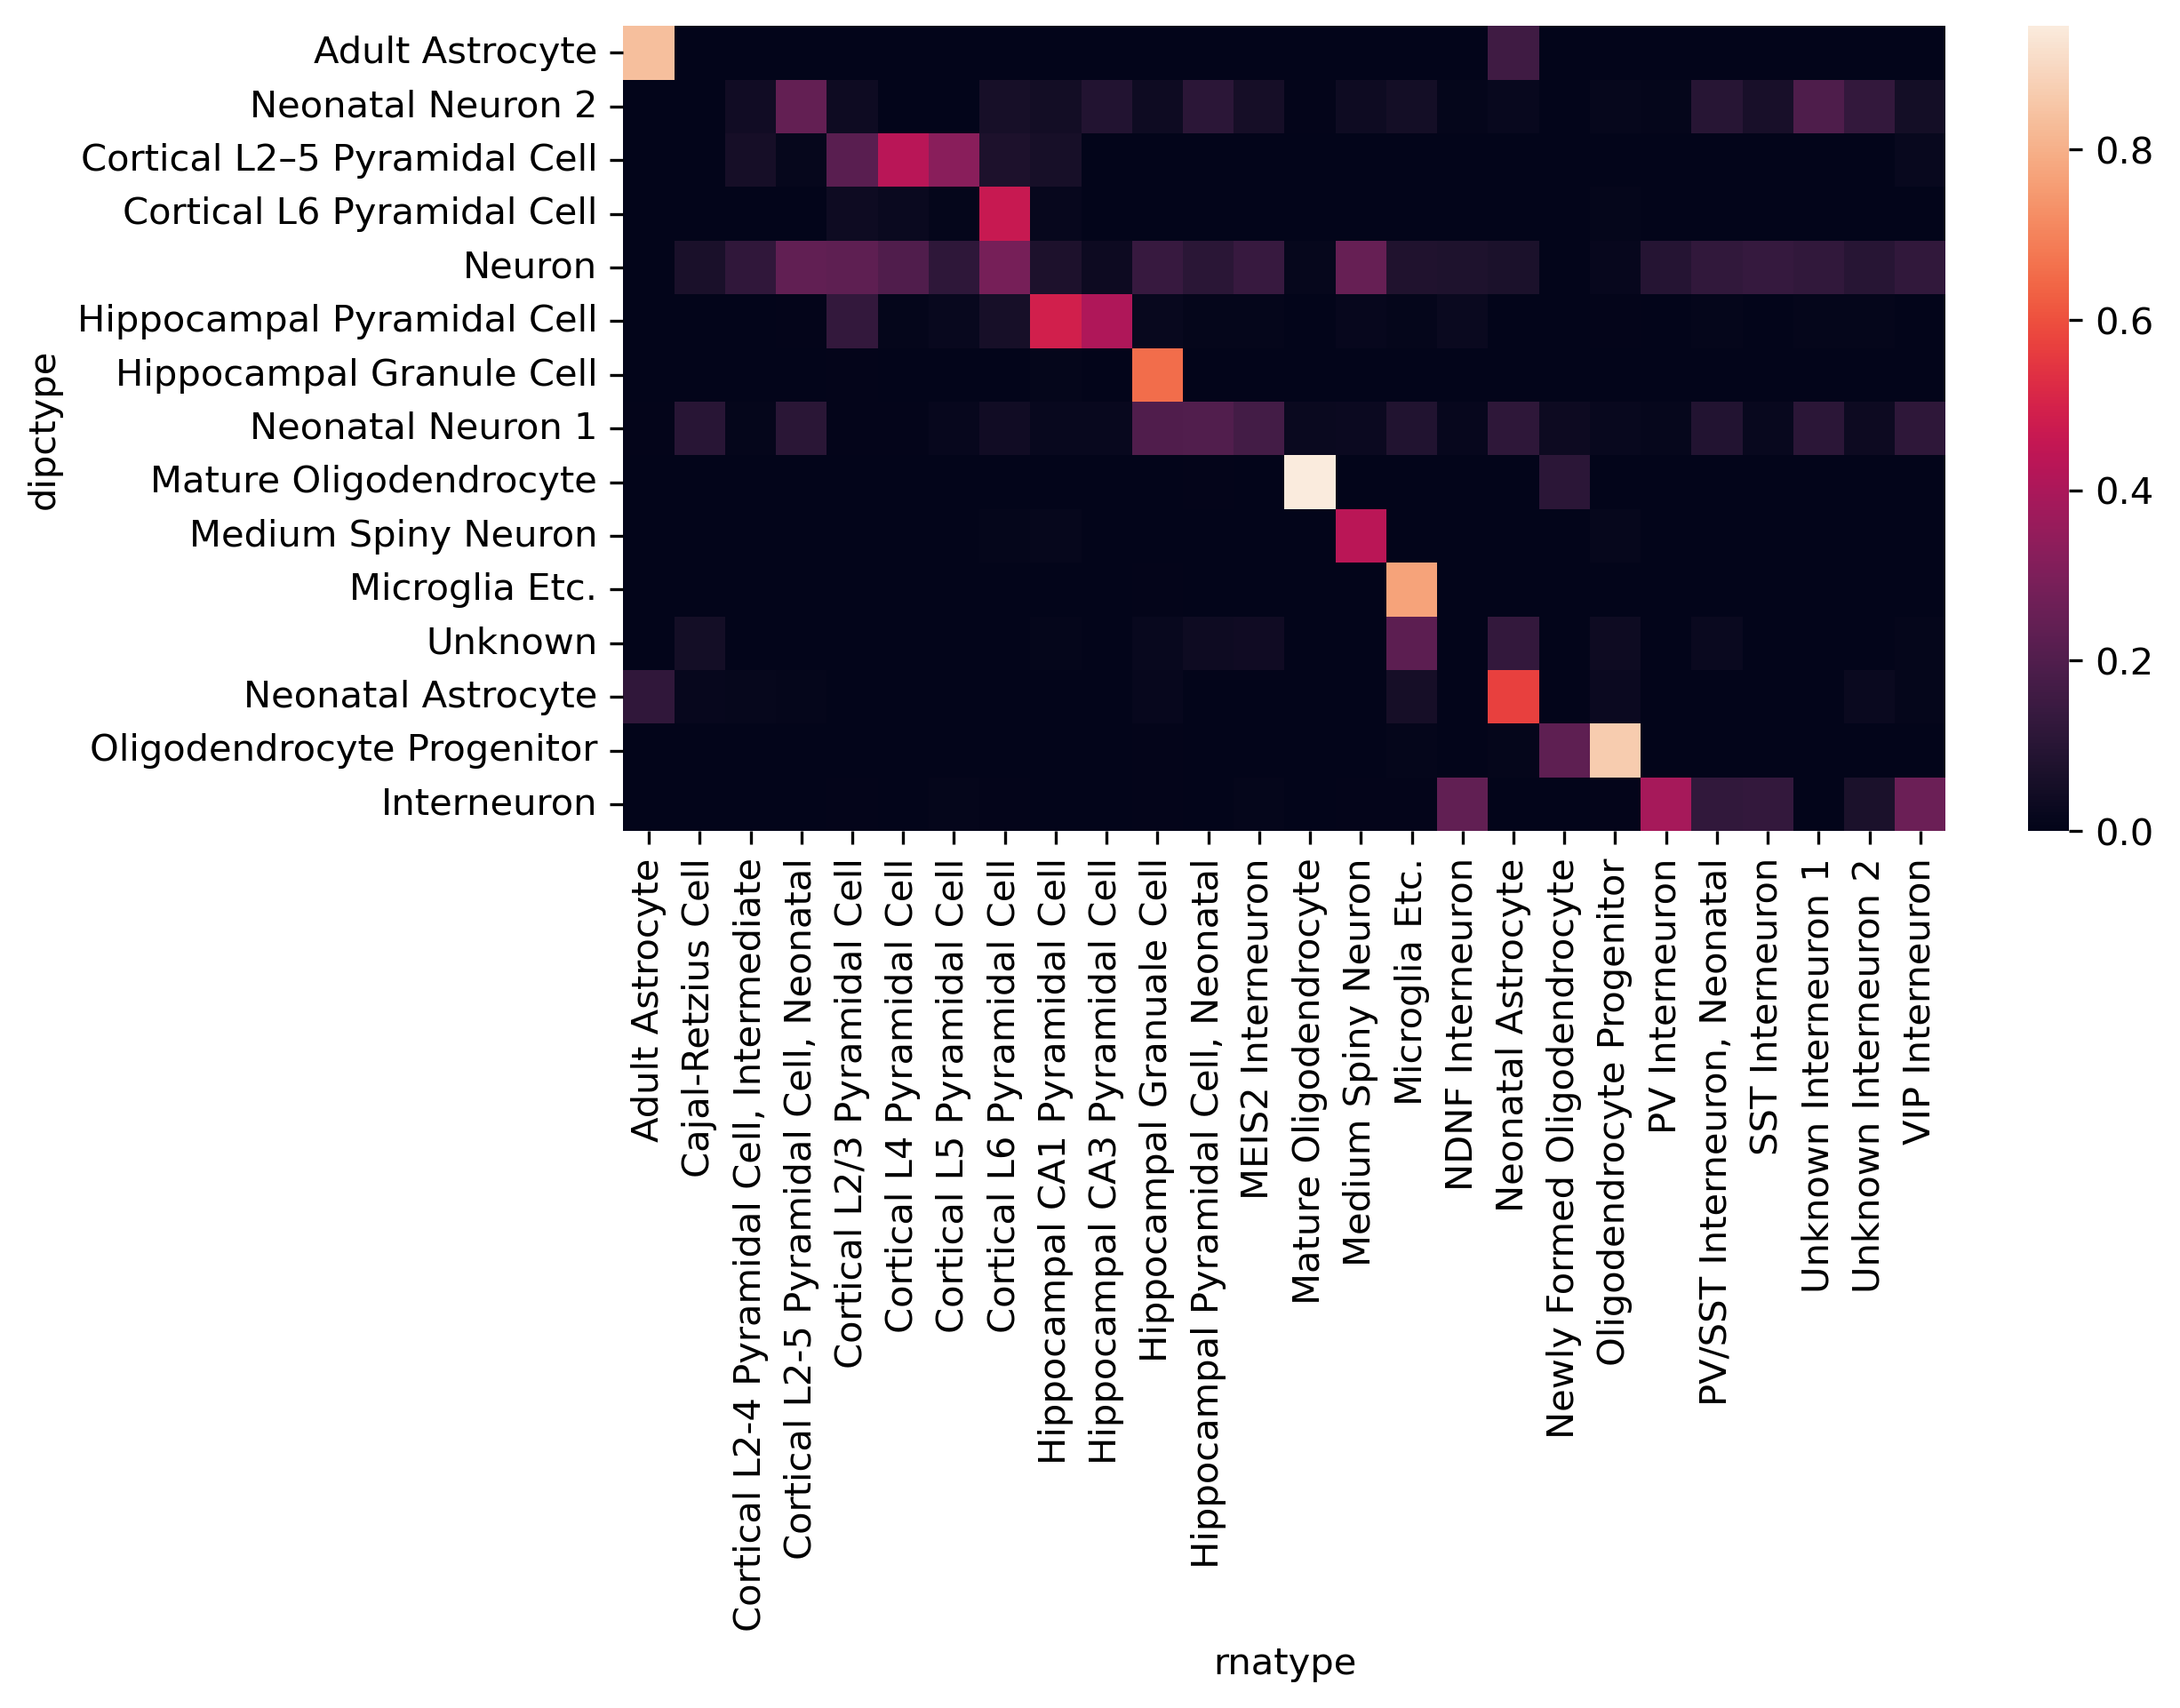
cf_matrix = cluster[['dipctype','rnatype']].value_counts().unstack().fillna(0)
cf_matrix = cf_matrix / np.sqrt(cf_matrix.sum(axis=1)[:,None]) / np.sqrt(cf_matrix.sum(axis=0))
idx = pd.Series(np.arange(cf_matrix.shape[1]), cf_matrix.columns)
fig, ax = plt.subplots(figsize=(8,4), dpi=300)
sns.heatmap(cf_matrix.iloc[np.argsort(idx[np.argmax(cf_matrix.values, axis=1)])], ax=ax)
<AxesSubplot:xlabel='rnatype', ylabel='dipctype'>
cluster['rnatype'].value_counts()
Microglia Etc.                                391
Cortical L6 Pyramidal Cell                    333
Hippocampal Granuale Cell                     309
Neonatal Astrocyte                            234
Cortical L2-5 Pyramidal Cell, Neonatal        211
Mature Oligodendrocyte                        210
Cortical L2/3 Pyramidal Cell                  204
Cortical L4 Pyramidal Cell                    195
Oligodendrocyte Progenitor                    189
Medium Spiny Neuron                           167
Adult Astrocyte                               144
Hippocampal CA1 Pyramidal Cell                134
VIP Interneuron                               112
Cortical L5 Pyramidal Cell                     98
Hippocampal Pyramidal Cell, Neonatal           93
Unknown Interneuron 1                          89
MEIS2 Interneuron                              88
PV/SST Interneuron, Neonatal                   85
Hippocampal CA3 Pyramidal Cell                 70
PV Interneuron                                 61
SST Interneuron                                55
Unknown Interneuron 2                          51
Cortical L2-4 Pyramidal Cell, Intermediate     37
NDNF Interneuron                               36
Newly Formed Oligodendrocyte                   27
Cajal-Retzius Cell                             23
Name: rnatype, dtype: int64
cluster.to_csv('Tan2021_dipc_cluster.csv.gz', )
| rnatype | score | dipctype | dipcleiden | |
|---|---|---|---|---|
| cortex-p028-cb_116 | Cortical L6 Pyramidal Cell | 0.999996 | Cortical L6 Pyramidal Cell | 5 |
| cortex-visual-control-p007-b6_182 | Cortical L6 Pyramidal Cell | 0.999992 | Neuron | 2 |
| cortex-p028-cb_112 | Cortical L6 Pyramidal Cell | 0.999996 | Cortical L2–5 Pyramidal Cell | 5 |
| cortex-visual-control-p001-b6_061 | Unknown Interneuron 2 | 0.330496 | Neuron | 2 |
| cortex-p056-cb_216 | Microglia Etc. | 0.999989 | Microglia Etc. | 14 |
| ... | ... | ... | ... | ... |
| cortex-visual-control-p021-b6_090 | Mature Oligodendrocyte | 0.999994 | Mature Oligodendrocyte | 16 |
| cortex-visual-control-p021-b6_012 | Cortical L6 Pyramidal Cell | 0.999997 | Neuron | 5 |
| hippocampus-p007-cb_046 | Microglia Etc. | 0.999993 | Microglia Etc. | 13 |
| cortex-visual-dark-p014-b6_106 | Microglia Etc. | 0.999994 | Microglia Etc. | 13 |
| cortex-visual-control-p021-b6_174 | Microglia Etc. | 0.999995 | Microglia Etc. | 13 |
3646 rows × 4 columns
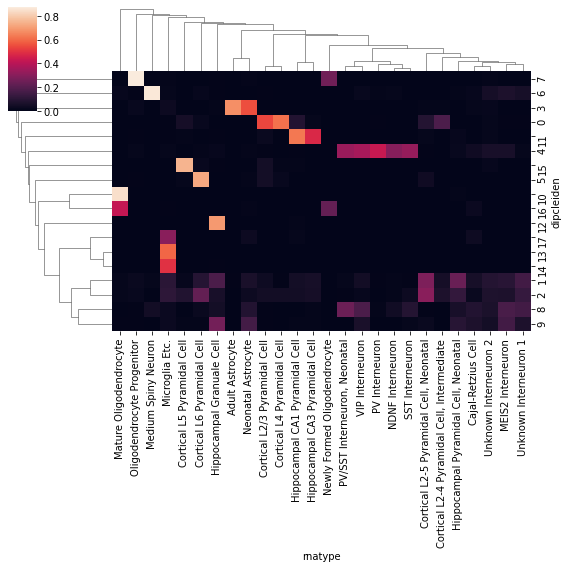
cluster['dipcleiden'] = adata_merge.obs.loc[hic_cell, 'leiden']
cf_matrix = cluster[['dipcleiden','rnatype']].value_counts().unstack().fillna(0)
cf_matrix = cf_matrix / np.sqrt(cf_matrix.sum(axis=1)[:,None]) / np.sqrt(cf_matrix.sum(axis=0))
idx = pd.Series(np.arange(cf_matrix.shape[1]), cf_matrix.columns)
sns.clustermap(cf_matrix, figsize=(8,8))
<seaborn.matrix.ClusterGrid at 0x7f0f48f22f50>